• 3 min read
Profit Margin: The key to measuring true business profitability
Record revenue growth doesn't guarantee profitable investments. Here's the number that separates efficient companies from revenue traps.
Explainer
A company's Profit Margin shows what percentage of every dollar of revenue actually becomes profit.
Profit margin reveals which companies run efficient operations versus those that struggle to turn revenue into actual money.
How to read profit margin numbers
Profit margins vary dramatically by industry, but these ranges provide a general guide:
- Above 20%: Exceptional efficiency (often tech/software companies)
- 10-20%: Strong profitability for most industries
- 5-10%: Decent margins (acceptable for capital-intensive businesses)
- Below 5%: Low margins (common in retail/grocery, concerning elsewhere)
Critical warning: Always compare stocks within the same industry: benchmarks differ depending on the type of business.
Formula
Profit margin is calculated by dividing a company's net income by its total revenue, then multiplying by 100 to get a percentage.
Let's put this formula to work with a comparison.
Example
This example shows how much profit different companies keep from the same revenue.
| Company | Revenue | Net Income | Profit Margin |
|---|---|---|---|
| Company A (Lower margin) | $100 million | $10 million | $10M ÷ $100M = 10% |
| Company B (Higher margin) | $100 million | $20 million | $20M ÷ $100M = 20% |
Key insight: Both companies generated the same revenue, but Company B kept twice as much profit from every dollar of revenue.
This is why headlines about "record revenue growth" can be misleading for investors.
Why profit margin matters
Profit margin exposes a common investor trap: companies can report growing earnings while becoming less efficient at making money. Absolute profit figures ignore how much revenue was required to generate those earnings.
Always check profit margins to spot declining efficiency before it shows up in headline numbers, and compare margins within industries to identify the most efficient operators.
The profit margin trap
Profit margin seems simple, but here's where many investors fail:
- The Industry Illusion: A 5% margin might be terrible for software but excellent for groceries. Never compare a tech company to a retailer.
- The One-Hit Wonder: A sudden 30% margin spike often results from one-time events like asset sales or accounting adjustments. Always verify whether unusual gains are inflating the numbers.
- The Seasonal Mirage: Seasonal businesses show misleading margins during off-peak periods. A swimwear company's winter margins appear poor, while summer margins reflect true operational efficiency.
The bottom line
Profit margin reveals the truth: 'How efficiently does this company turn revenue into profit?'
Before buying any stock, always examine its profit margin trends and compare them to competitors. You might discover that a company with smaller total profits actually operates more efficiently than a larger competitor with poor margins. Analyze profit margin alongside other stock fundamentals to get a complete picture of company quality.
This is how you avoid buying a profit trap—by focusing on efficiency over headlines.
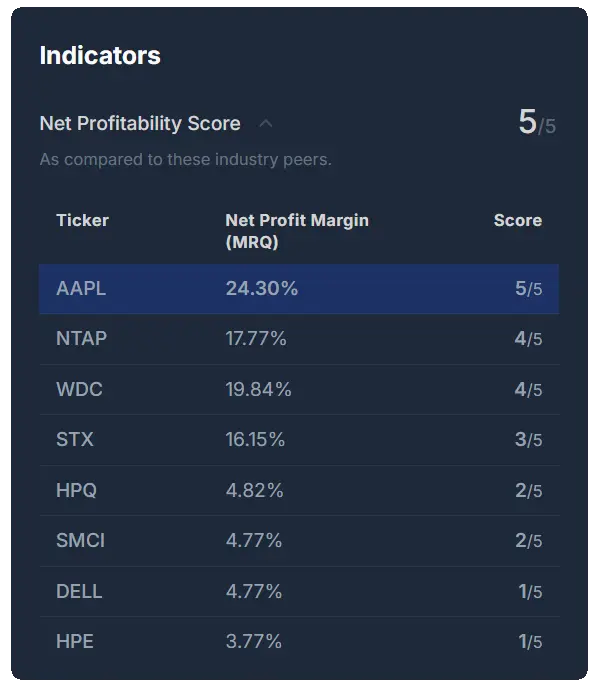
Ready to spot the most efficient companies?
Our Net Profitability Score instantly ranks every stock against its industry peers—so you can identify the best operators at a glance, without manual comparison.