• 7 min. leestijd
Warren Buffett Portfolio: See What Stocks Buffett Owns (Live Heatmap)
Tracking what Warren Buffett owns requires scrolling through Berkshire Hathaway's quarterly 13F filings with 40+ stock holdings across dense tables. A Warren Buffett portfolio heatmap shows you his entire portfolio in a single visual snapshot, revealing quality patterns and investment philosophy through metric analysis.
What does Warren Buffett own right now?
Warren Buffett's portfolio through Berkshire Hathaway reveals a value investing approach focused on quality businesses with durable competitive advantages.
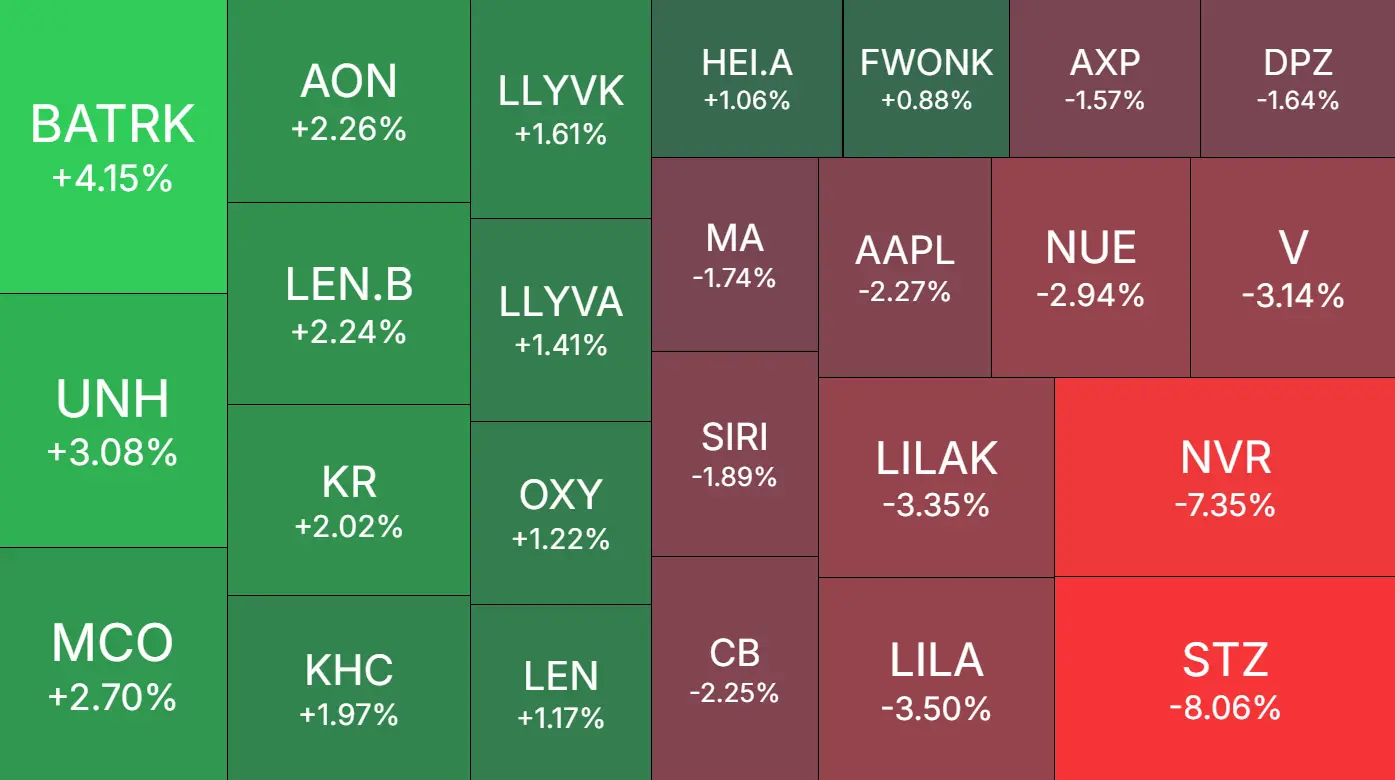
The heatmap displays all Berkshire Hathaway stock holdings simultaneously, letting you analyze the entire portfolio through different metrics:
- Profit margin view: Reveals which holdings show strong profitability and pricing power
- Dividend yield view: Exposes income-generating positions versus growth stocks
- P/E ratio view: Shows valuation discipline across holdings
- Percent change view: Tracks recent performance across multiple time frames
View Warren Buffett's complete portfolio instantly:
Explore Warren Buffett's live portfolio heatmap to see all Berkshire Hathaway holdings visualized by performance, fundamentals, or income metrics.
How to read Warren Buffett's portfolio heatmap
Warren Buffett's portfolio heatmap uses visual properties to communicate portfolio data instantly.
Color intensity shows metric strength. Deeper, more intense colors indicate stronger values (positive or negative). For example, a red to green spectrum might show losses to gains when viewing performance metrics.
Tile size represents the metric being measured. The largest tiles show both the highest and lowest values, while median-sized tiles show average values. This makes outliers at both ends immediately visible.
Stock labels identify each holding by ticker symbol, letting you recognize individual positions at a glance. The displayed metric value appears on each tile.
The key principle: visual intensity (whether through color, size, or both) indicates the magnitude of the value being measured.
What Warren Buffett's portfolio heatmap reveals instantly
Quality signals through profit margins. The profit margin view shows the profitability range across Buffett's holdings. Spot which businesses convert revenue to profit most efficiently, and which sit at the lower end of his quality range. Even his weakest-margin holdings may exceed typical market averages.
Dividend income strategy. The dividend yield view exposes which holdings contribute cash flow to Berkshire versus pure growth plays. See how Buffett balances income-generating stocks with zero-yield compounders.
Value vs growth positioning. The P/E ratio view reveals whether Buffett leans toward value or growth across his current holdings. See where he accepts premium valuations and where he demands low multiples.
Recent performance patterns. The percent change view shows which holdings are leading or lagging across different time frames. Switch between 1-day, 1-week, 1-month, and year-to-date to see how momentum differs across positions.
Extreme value outliers. Whichever metric you view, the largest tiles flag the holdings worth investigating first: the outliers at both ends of the spectrum.
Tracking Warren Buffett's current holdings
The heatmap reflects Berkshire Hathaway's most recent 13F filing, showing every stock Buffett currently holds. Berkshire files quarterly with the SEC (mid-February, mid-May, mid-August, mid-November), and the heatmap updates each time a new filing publishes.
The percent change view shows how each current holding has performed recently. Switch between time frames (1-day, 1-week, 1-month, year-to-date) to see which stocks are gaining or losing value right now. This reveals short-term momentum across the portfolio without any manual lookups.
Keep in mind: 13F filings report holdings from the previous quarter-end, so the heatmap always shows a snapshot of what Buffett owned at that date, not real-time trade activity.
Warren Buffett portfolio heatmap vs 13F filings
Different methods serve different purposes when tracking Warren Buffett's investments.
Traditional 13F filings display Berkshire Hathaway holdings in text tables with ticker symbols, share counts, and dollar values. Reading these requires scrolling through 40+ rows, manual calculation of fundamental metrics, spreadsheet analysis to compare holdings, and separate lookups for profit margins, dividend yields, and P/E ratios.
Warren Buffett portfolio heatmap displays all holdings visually with metrics already calculated. You instantly see all stocks Buffett owns, which holdings show the strongest profit margins, how stocks rank on dividend yield or P/E ratio, and recent performance across multiple time frames.
The time difference matters. Scanning a heatmap takes seconds while analyzing text filings takes hours. Visual encoding reveals quality patterns, valuation differences, and income strategies without manual comparison across spreadsheet rows or separate fundamental lookups.
Pattern recognition advantage. Your brain processes visual patterns faster than numerical tables. The heatmap exploits this: profitable businesses show through strong margin colors, income stocks emerge through dividend yield patterns, and P/E ratio distributions expose valuation discipline.
The investing rules behind Buffett's portfolio
Concentrate on your best ideas. Berkshire doesn't spread capital evenly across 40+ holdings. A handful of positions represent the majority of portfolio value. This teaches that conviction matters more than diversification for its own sake.
Buy businesses, not tickers. Buffett's holdings stay unchanged for years, sometimes decades. He's not trading price movements. He's owning businesses he believes in long enough for their value to compound. The heatmap reflects this: the same names, quarter after quarter.
Quality has a price worth paying. Value investing doesn't mean buying cheap stocks. It means buying quality businesses at prices that make sense. Buffett regularly pays fair prices for exceptional businesses rather than bargain prices for mediocre ones.
Ignore what you can't predict. Short-term market noise doesn't move Buffett's portfolio. His holdings don't change because of economic forecasts, interest rate speculation, or market sentiment. The consistency visible in the heatmap is itself a lesson in ignoring the noise.
Comparing Warren Buffett to other superinvestors
Different legendary investors display distinct heatmap patterns when viewed through metric lenses.
Cathie Wood (ARK Invest) shows heavy concentration in high-growth stocks. Her heatmap reveals premium valuations (P/E ratio view shows warmer colors indicating higher multiples), lower profit margins (cooling colors on margin view showing unprofitable growth companies), and high volatility (percent change view shows dramatic swings). This contrasts sharply with Buffett's stable, profitable, value-focused pattern.
Michael Burry (Scion Asset Management) runs a concentrated portfolio with contrarian positions. His heatmap often shows deep value characteristics: low P/E ratios (cool colors on valuation view) and beaten-down stocks with negative recent performance. Comparing Burry to Buffett reveals different value investing approaches: Burry invests in distressed situations, Buffett in quality businesses temporarily undervalued.
Bill Ackman (Pershing Square) maintains extreme concentration with activist engagement. His heatmap shows fewer total holdings than Buffett (6-8 stocks vs 40+), and metric patterns reveal concentrated bets on specific investment theses. Activist investing is focused by design. Buffett's approach is deliberately broader.
Viewing multiple superinvestor heatmaps side-by-side exposes how different strategies approach the same market conditions. Switch between profit margin, P/E ratio, and dividend yield views to see how each investor balances quality, valuation, and income differently.
Warren Buffett portfolio takeaways
Warren Buffett's portfolio heatmap answers the question: "What does the most successful investor of our generation actually own, and what patterns can I learn?"
Before building your own portfolio, study how Buffett constructs his through different metric lenses. The profit margin view reveals quality focus, dividend yield patterns expose income strategy, P/E ratio distributions show valuation discipline, and percent change tracking reveals long-term stability.
Different metrics expose different lessons. Switch between views to understand how Buffett balances profitability, income, valuation, and growth across his holdings.
This is how you learn value investing principles from the master himself: not by copying positions, but by understanding quality, value, and income patterns through visual metric analysis.
Frequently Asked Questions
How often does Warren Buffett's portfolio update?
Berkshire Hathaway files quarterly 13F reports within 45 days of quarter-end. The portfolio heatmap updates four times per year (mid-February, mid-May, mid-August, mid-November) reflecting holdings from the previous quarter. Each update shows current holdings and allows metric analysis across profit margins, dividend yields, P/E ratios, and performance.
Should I copy Warren Buffett's stock picks?
Study Buffett's portfolio for educational value, not to blindly copy positions. The heatmap teaches principles through metric analysis: profit margins reveal quality focus, dividend yields show income strategy, P/E ratios demonstrate valuation discipline. Apply these principles to your own research rather than copying specific positions without understanding the underlying investment thesis.
What metrics matter most when analyzing Buffett's portfolio?
Different metrics reveal different insights. Profit margin shows his quality bias (preference for profitable businesses with pricing power). Dividend yield exposes income strategy (mix of dividend payers and growth stocks). P/E ratio demonstrates valuation discipline (seeking reasonable prices, not chasing expensive growth). Percent change reveals long-term stability (consistent performance over time). Switch between all views for complete understanding.