Gepubliceerd
• 7 min. leestijd (EN)
Analyst Expectations: Earnings Beats, Targets, and Bias
Analyst expectations look authoritative, but the numbers behind them tell a stranger story. Roughly 75% of S&P 500 companies beat earnings estimates every quarter, long-term EPS forecasts lose to a random walk past three years, and only about 30% of 12-month price targets hit. Run the reverse dcf calculator on any stock to compare the analyst growth story to the one the market is actually pricing.
Why 75% of companies beat earnings estimates
FactSet puts the 10-year S&P 500 beat rate at 76%, the 5-year at 78%, and recent quarters higher: Q3 2025 hit 87%, Q1 2026 reported 84%. Numbers like that would be implausible if the bar were honest. It is not.
Two practices drive the result. Companies guide low so the print clears the bar with room to spare. And analysts walk consensus down through the quarter as management drops hints, so the published estimate the company "beats" is a number that has been shaped, not predicted.
The magnitude of the surprise tells a similar story. Q1 2026 reported a 20.7% aggregate earnings surprise versus a 5-year average of 7.3%, a one-quarter outlier driven by a handful of mega-cap names. The headline "biggest beat since 2021" hides a concentration story that does not generalize.
A "beat by a penny" carries almost no information. The interesting numbers are the ones around the print: the magnitude of the beat versus history, the direction of guidance for the next quarter, and the size of the consensus revision in the days that follow.
Where analyst forecasts are reliably wrong
Accuracy collapses with the horizon. Quarterly EPS estimates are tight. Long-term EPS estimates are not. Academic work shows a random walk forecast beats analysts at three-year-ahead earnings for the median large-cap stock, and the median forecast error stays optimistically biased and grows with the horizon.
The bias is also uneven across credit quality. NBER research found the mean consensus forecast sits 35% above actual earnings for firms in the worst credit-rating quintile, but only 5% above for firms in the best-rated quintile. Forecasts are most wrong for the companies most likely to disappoint.
For high-growth stocks, the same research describes analyst forecasts as "too extreme" in both directions, more often the upside. Industry-level long-term growth forecasts beat firm-level ones on accuracy, which is a polite way of saying analysts know less about a single name's distant future than the industry average implies.
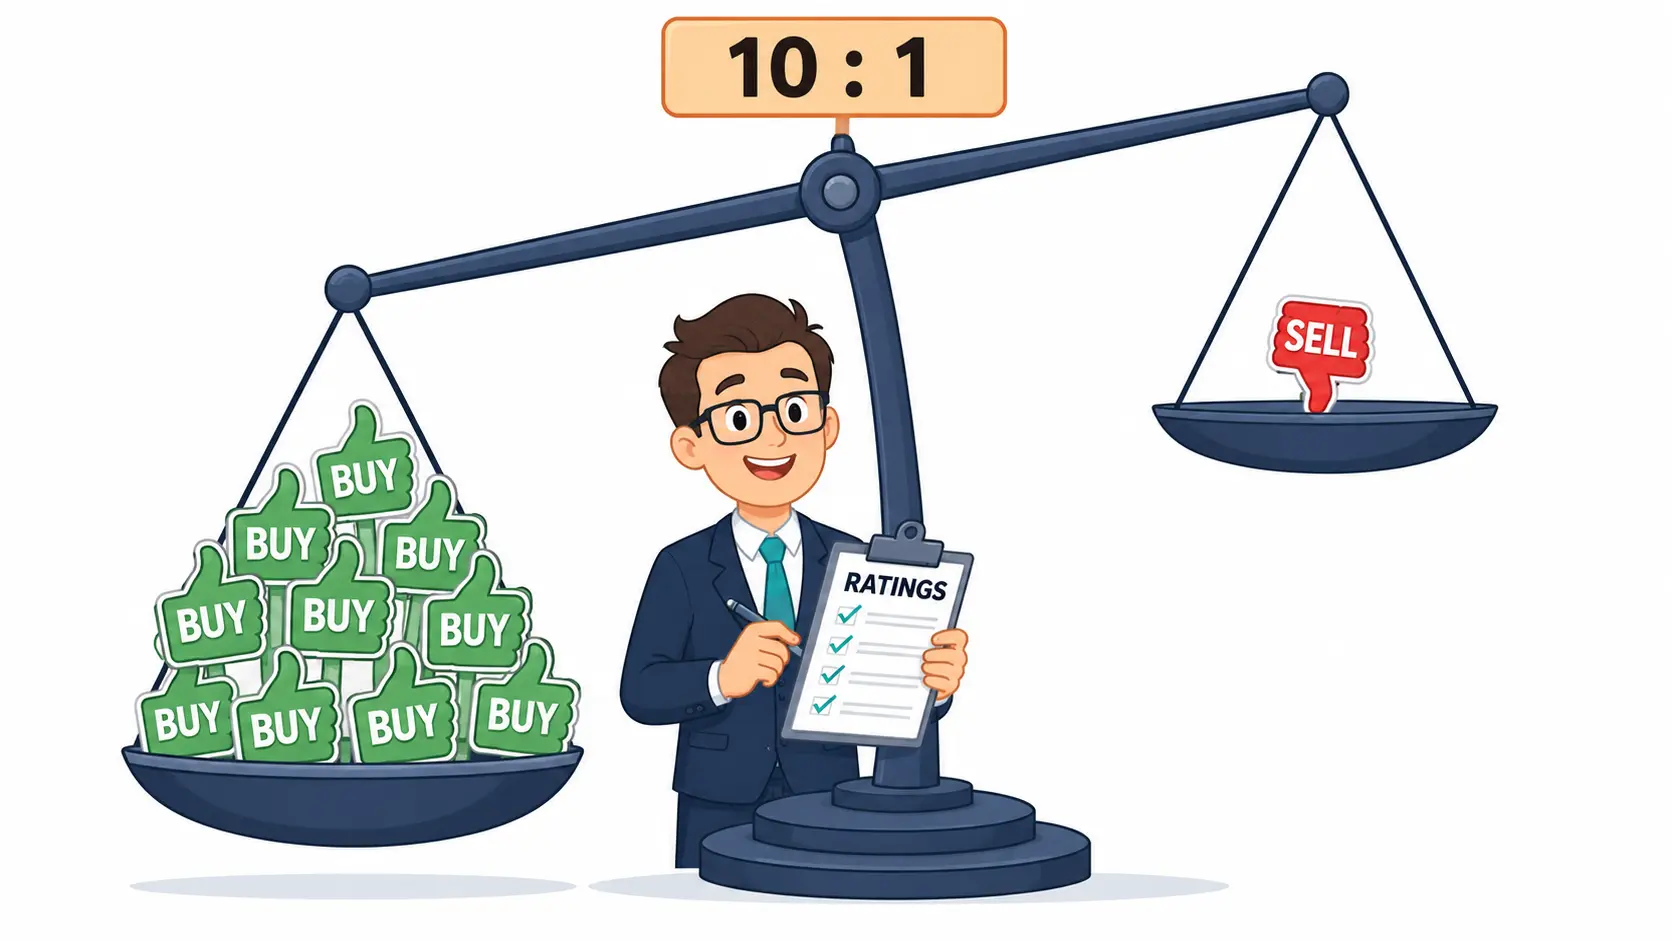
Buy ratings beat sell ratings 10 to 1
The rating distribution has always leaned positive. In June 2000, 74% of outstanding ratings were buys and only 2% were sells. The 2003 Global Analyst Research Settlement and 2002 NASD disclosure rules forced firms to publish their distributions. The share of buys dropped to about 42% by mid-2003. Sells stayed rare. Two decades later, they still sit in the single digits.
The mechanics are mundane. A sell rating annoys management, who stop taking the analyst's calls. Investment-banking relationships still correlate with optimism behind any "Chinese wall," and compensation indirectly tied to deal flow keeps the median rating high. A buy rating from a 75%-buy firm is information-thin. A sell rating, anywhere, is loud.
Price targets: 30% accuracy at the deadline
Analyst price targets carry a 12-month label, but the empirical accuracy at that horizon is poor. Across academic work, strict 12-month hit rates land near 30%. The looser test ("did the price reach the target at any point during the 12 months?") gets to 50-60%. Direction-of-move accuracy is around 54%, barely above a coin flip.
Worse, accuracy decays fastest in the first weeks after publication. A target issued today carries its highest informational value over the next one to three months, then drifts. Analysts know this, which is why upgrades and downgrades cluster around earnings prints. The 12-month label is more a regulatory artifact than a real forecasting horizon. Treat targets as directional short-horizon signals, not endpoints.
The whisper number is the bar that moves stocks
The published consensus is one bar. The buy side prices a different one.
The whisper number is an unofficial buy-side EPS estimate that circulates among institutional clients. As of mid-2023, the published whisper has been closer to actual reported earnings than the consensus 70% of the time. Price action follows the whisper, not the headline.
Stocks that beat the whisper close up 1.8% on average and finish higher 60% of the time. Stocks that beat the consensus but miss the whisper close down 0.3% on average and finish lower 55% of the time. A beat that "fails" usually cleared the wrong bar.
How to read analyst expectations without getting played
Five rules cover most of what you need.
Trust revisions, not levels. A consensus EPS estimate of $5 means little. A consensus revising from $5 down to $4.70 over six weeks before a print is information. Revisions predict post-earnings returns; levels mostly do not. Analysts are also slow to fully incorporate surprises, taking up to five months to revise consensus the rest of the way (Zhang, Columbia). The first three weeks after a print carry the highest revision signal.
Watch dispersion. The standard deviation of estimates around the mean tells you how much analysts agree. Tight dispersion is meaningful conviction. Wide dispersion means consensus is a label hiding real disagreement.
Discount long-term EPS forecasts heavily. Anything labelled 5-year is closer to commentary than forecast. For long-horizon work, prefer industry growth averages and a reverse dcf over a single analyst's long-term EPS line.
Read the rating distribution before the rating. A buy at a firm with 80% buys is not the same signal as a buy at a firm with 35% buys. Sells, anywhere, deserve attention.
Pair forecasts with the print. Treat the earnings report walkthrough as a cross-check on consensus: revenue quality, cash conversion, segment trends. Consensus is shape; the filing is substance.
The consensus is not wrong because analysts are unintelligent. It is wrong because of the system around it: incentives that favor optimism, horizons that exceed forecasting capacity, and a buy side that prices its own bar. Open the reverse dcf calculator and compare the analyst story to the growth rate the market is actually paying for.
Frequently Asked Questions
Why do 75% of companies beat analyst earnings estimates? Because the bar is engineered. Companies guide low and analysts revise consensus down through the quarter as management drops hints. A "beat by a penny" against a softened estimate reflects guidance management more than business surprise. The interesting numbers are the magnitude of the beat versus history and the direction of next-quarter guidance.
How accurate are analyst price targets? Strict 12-month hit rates land near 30%. About 50-60% of targets are reached at some point during the 12-month window. Direction-of-move accuracy hovers around 54%, barely above a coin flip. Targets carry most of their informational value in the first one to three months after publication, then decay quickly.
Should I trust analyst long-term EPS growth forecasts? With caution. A random walk forecast beats analysts on three-year-ahead earnings for the median large-cap stock. Median forecast errors stay optimistically biased and grow with the horizon. For long-horizon work, prefer industry growth averages or a market-implied growth rate from a reverse DCF over a single analyst's 5-year line.
Why does a stock sometimes fall after beating earnings? Usually one of three reasons. Guidance for the next quarter came in below expectations. The buy-side whisper number sat higher than the published consensus, and the company beat consensus but missed the whisper. Or the beat came from low-quality items (a tax benefit, a share buyback shrinking share count) rather than from operations.