Gepubliceerd
• 7 min. leestijd (EN)
Cost of Goods Sold (COGS): Formula, Margin, and Pitfalls
Cost of Goods Sold (COGS) is the direct cost of producing whatever a company sold this period: raw materials, factory labor, manufacturing overhead, and inbound freight. Revenue minus this line equals gross profit, the cleanest signal of pricing power on any income statement. Open the profit margin calculator to see what each dollar of revenue survives the COGS line.
Why COGS Matters
Cost of Goods Sold sits one line below revenue on every income statement. Revenue measures the top of the funnel; this line measures what it takes to deliver the product. The gap between them, gross profit, is the pool that has to fund every other expense: research, sales, headquarters, interest, taxes. A company with thin gross margin starts each quarter with a small pool to spread across everything else.
Gross margin reads as a single number across every business, which is why analysts treat it as the cleanest peer-comparison metric. A 70% gross margin tells you the unit economics work. A 10% margin tells you the company has to win on volume. Per Damodaran's January 2026 sector data, software firms average 71.7% gross margin, retailers 33.2%, auto manufacturers 10.4%. Same income-statement line, different businesses entirely.
This line also exposes commodity, freight, and labor inflation faster than any other. When steel prices rise or wages climb, this is where it shows up first. A widening ratio of Cost of Goods Sold to revenue across consecutive quarters with revenue flat is the early warning that pricing power is slipping, ahead of the damage showing in profit margin at the bottom of the statement.
How COGS Works
The Cost of Goods Sold formula starts from inventory accounting:
What goes in: raw materials, direct labor, manufacturing overhead (factory rent, utilities, equipment depreciation), and freight-in. What stays out: selling expenses, marketing, R&D, headquarters salaries, and freight-out. The IRS draws the same line on Schedule C: inbound freight in COGS, outbound shipping below the gross profit line as a selling expense. Stock-based compensation tied to manufacturing staff goes in; corporate-office equity grants do not.
The same physical inventory can produce different reported numbers depending on the cost-flow method. A retailer buys 100 units at $10 in January, 100 units at $14 in June, and sells 100 units in December at $20 each. Revenue = $2,000.
| Method | COGS | Gross Profit | Gross Margin |
|---|---|---|---|
| FIFO (first in, first out) | $1,000 | $1,000 | 50% |
| LIFO (last in, first out) | $1,400 | $600 | 30% |
| Weighted average | $1,200 | $800 | 40% |
Same physical activity, three reported gross margins. In an inflationary period, FIFO charges old, cheaper inventory first, depressing COGS and inflating reported income. LIFO charges newer, more expensive inventory first and does the opposite. US GAAP permits all three methods plus specific identification. IFRS bans LIFO under IAS 2, so cross-border comparison breaks for any US firm on LIFO unless the footnote LIFO reserve is used to back out a FIFO-equivalent. Inventory-method choice also feeds straight into GAAP versus non-GAAP earnings on the same business.
COGS by Sector
Industry structure determines what goes into Cost of Goods Sold and how big the line gets. A software firm has near-zero raw materials and a server bill that scales with usage. An automaker turns thousands of dollars of steel, aluminum, and labor into each vehicle. Compare gross margin against the same sector, never the broad market.
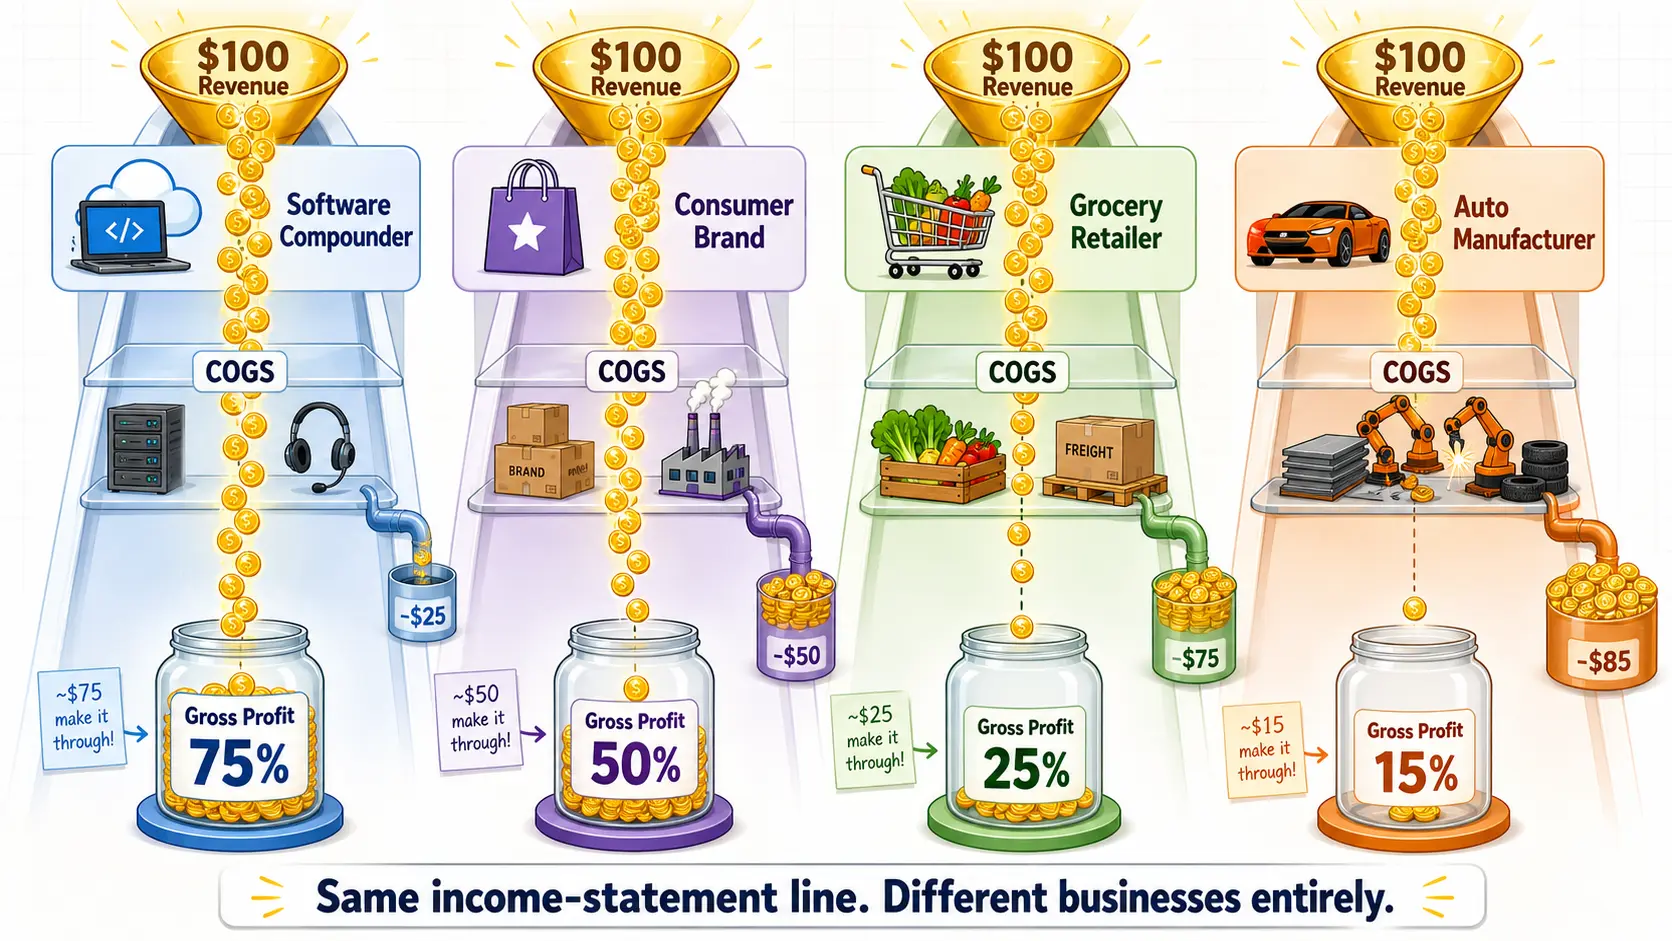
| Dimension | Software Compounder | Consumer Brand | Grocery Retailer | Auto Manufacturer |
|---|---|---|---|---|
| Gross margin | 70-85% | 45-55% | 20-30% | 10-20% |
| What's in COGS | Hosting, support | Inputs, packaging, plant | Wholesale goods | Steel, parts, labor |
| Inventory exposure | Low | Medium | Very high | Very high |
| Best for | Pricing-power signal | Brand equity check | Volume-and-cost screen | Cycle-position read |
A 50% gross margin reads as average for a branded consumer-goods firm and exceptional for a grocer. Costco's fiscal 2025 gross margin was 11.12%, with a disclosed 7-basis-point drag from a LIFO charge. Apple's fiscal 2024 split is the cleanest illustration of how Cost of Goods Sold splits a single income statement: Products gross margin around 37%, Services around 74%, on $391B of revenue. The blended 46% margin hides two very different businesses inside one 10-K. The same logic flows into EBITDA one line below: a thin gross margin caps how much operating profit the rest of the income statement can produce.
Where COGS Misleads
Cost of Goods Sold is among the most manipulated lines on the income statement, because shifting costs above or below it changes reported gross profit without changing the underlying business.
Capitalizing operating costs into inventory. Costs that should hit the income statement as expense get parked on the balance sheet as inventory or fixed assets. Reported COGS falls in the current period; gross margin rises; the day of reckoning arrives when the inflated assets get written down. Waste Management did this between 1992 and 1997, extending the useful lives of trucks and dumpsters by 5 to 10 years and cutting depreciation by $1.7B. WorldCom's 2002 fraud applied the same playbook to operating-line costs, capitalizing roughly $3.8B of expense.
LIFO liquidation. When a LIFO firm sells more inventory than it replaces, it dips into older layers stamped at lower historical costs. Reported COGS drops, gross margin spikes, and the boost is one-time. The signal is rising gross margin paired with a falling LIFO reserve disclosed in the inventory footnote.
Freight-out misclassification. Outbound shipping to customers belongs in selling expense, not COGS. Some firms quietly book it above the gross profit line and inflate the apparent gross margin.
Channel stuffing. Recognizing revenue and COGS for goods shipped but not really sold inflates both lines and flatters near-term margins. The SEC has settled cases at Bristol-Myers Squibb ($150M), McAfee ($50M), and Symbol Technologies ($131M). Match Cost of Goods Sold trends against free cash flow to catch the gap before it shows up in the next restatement.
Run any company through the profit margin calculator to see what survives the Cost of Goods Sold line, and compare the result against sector benchmarks before drawing conclusions.
Frequently Asked Questions
What is included in cost of goods sold? Cost of Goods Sold captures the direct costs of producing the goods or services sold during the period: raw materials, direct labor, manufacturing overhead, equipment depreciation tied to production, and inbound freight. Selling expenses, marketing, R&D, headquarters salaries, and outbound shipping to customers stay below the gross profit line. The split is industry-dependent: a SaaS firm's hosting costs and customer-support payroll go in this line; a retailer's warehouse costs often do not.
What is the difference between cost of goods sold and cost of revenue? Cost of Goods Sold is the term most product companies use. Cost of Revenue is the broader version reported by service and SaaS firms, since "goods" is misleading when there is no inventory. They occupy the same line on the income statement and answer the same question: the direct cost of delivering whatever was sold during the period.
How do FIFO and LIFO change cost of goods sold? FIFO charges the oldest inventory costs against current revenue first; LIFO charges the most recent costs first. In an inflationary environment, FIFO produces lower COGS and higher reported gross profit; LIFO produces higher COGS and lower reported gross profit. US GAAP allows both; IFRS bans LIFO under IAS 2. The LIFO reserve in the inventory footnote lets analysts convert LIFO statements to a FIFO-equivalent for cross-firm comparison.
Is freight included in cost of goods sold? Inbound freight, the cost of shipping raw materials and components into the factory or warehouse, belongs in Cost of Goods Sold. Outbound freight, the cost of shipping finished product to the customer, belongs below in selling expense. IRS Publication 334 makes the same distinction on Schedule C. Mixing them flatters the apparent gross margin without changing anything about the underlying business.