Updated
• 4 min read (EN)
P/E Ratio: The expensive truth about cheap stocks
Why higher P/E stocks can actually be the better long-term investment.
Explainer
A stock's Price to Earnings Ratio (P/E) tells you if a stock is expensive relative to how fast it is actually growing.
In general, a lower P/E suggests you are paying less for each dollar of earnings - though high-growth companies often justify higher ratios.
How to read P/E numbers
P/E numbers typically fall into three ranges:
- P/E below 15: Potential value opportunity or mature/slow-growth business
- P/E 15-25: Fair value range for most established companies
- P/E above 25: Premium pricing that requires strong growth to justify
These ranges serve as general guidelines, though different industries have different norms.
Formula
A P/E ratio is calculated by dividing a stock's price by its earnings per share (EPS).
Example
This example shows two companies with the same stock price but with different P/E multiples.
| Company | Stock Price | Current Earnings Per Share (EPS) | P/E Ratio | 5-year EPS Projection |
|---|---|---|---|---|
| Company A (Fast growth) | $100 | $4 | 25 | $4 × 1.25^5 = $12.21 |
| Company B (Mature business) | $100 | $8 | 12.5 | $8 × 1.05^5 = $10.21 |
Surprised? Company A's EPS of $12.21 beats Company B's EPS of $10.21 after 5 years. You paid double the P/E ratio but got 20% more earnings per share.
In our example, Company A (P/E 25) justified its premium pricing through superior earnings growth, while Company B (P/E 12.5) delivered steady but slower earnings growth.
Put your P/E knowledge to work
Search any stock on our Stock Page to instantly see its P/E ratio, growth rates, and whether you're getting a good deal.
Why P/E beats earnings growth alone
The reason P/E is the better indicator is because earnings growth rates only show how fast a company is expanding but ignore what price you are paying for that growth.
- Valuation determines your actual returns
- A company growing earnings 20% with P/E 40 might give worse returns than one growing 10% with P/E 10
- You can overpay even for the fastest-growing companies
This explains why high P/E stocks can sometimes offer better value than low P/E alternatives. The P/E vs PEG comparison spells out exactly when growth justifies a higher multiple.
When does P/E work best?
P/E is most effective for:
- Consistently profitable companies with stable earnings patterns
- Comparing companies within the same industry or sector
- Mature businesses with predictable, established operations
Important limitations
Always remember that the P/E ratio is not a standalone solution. Limitations to consider:
- Cyclical companies may show misleading earnings during peak/trough cycles
- Very high P/E ratios (50x+) often indicate speculative pricing
- P/E ratios do not work for companies with negative or volatile earnings
The bottom line
P/E ratio answers a critical question: "Am I paying a fair price for this company's earnings?"
Before buying any stock, always calculate its P/E. You might discover that the stock with a high P/E ratio (25x) actually delivers better long-term value than the stock with a low P/E ratio (12.5x) - if the growth materializes. Combine P/E with other stock fundamentals for a complete analysis.
This makes the difference between looking at price and understanding value.
Frequently Asked Questions
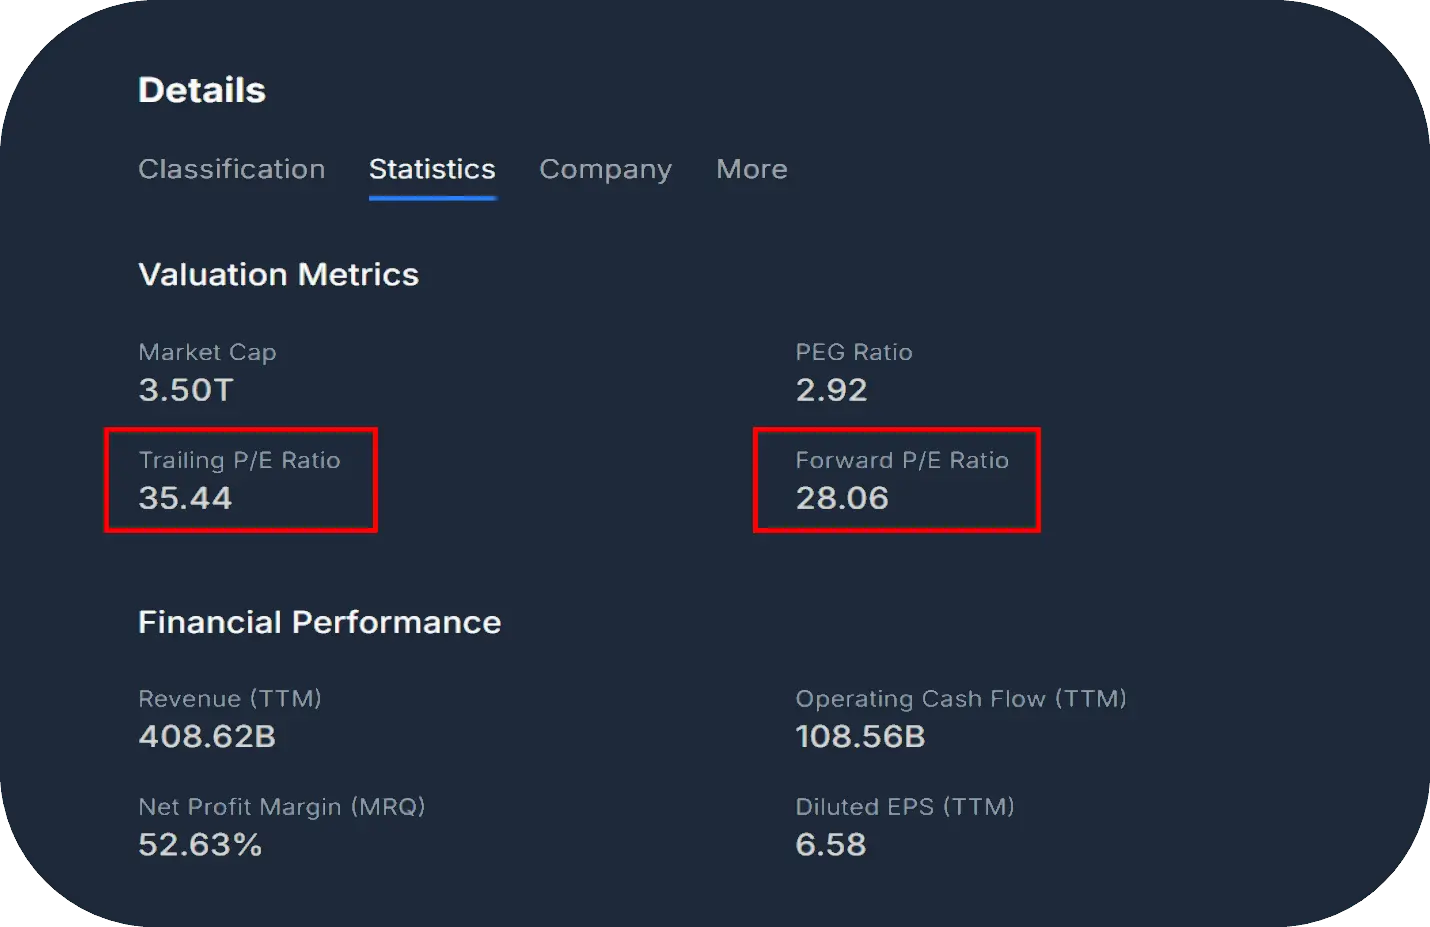
What is the difference between trailing and forward P/E? Trailing P/E uses the company's reported earnings from the last twelve months, so it is grounded in numbers that already exist. Forward P/E uses analyst estimates for the next twelve months, which reflects expectations but can shift quickly when forecasts are revised. Most investors glance at both: a large gap between the two usually signals that analysts expect a sharp change in profits.
What is the Shiller P/E or CAPE ratio? The Shiller P/E, also called CAPE, was developed by economist Robert Shiller and divides the current index price by the average inflation-adjusted earnings of the past ten years. Smoothing earnings over a full cycle reduces the distortion that normal P/E suffers during booms and recessions. It is most often applied to broad markets like the S&P 500 rather than to individual stocks.
Why do different sectors have such different "normal" P/E ratios? Sectors with high expected growth, like software and consumer technology, tend to trade at higher P/Es because investors price in years of future expansion. Mature sectors with slow, stable earnings, like utilities, banks, and energy, typically sit at lower multiples because the growth runway is shorter. Comparing a tech stock's P/E to a utility's without adjusting for sector norms is the classic beginner mistake.
When should I use PEG instead of P/E? PEG is the better tool whenever growth is the central part of the investment thesis, since it divides P/E by the earnings growth rate and rewards companies that are actually expanding. P/E alone can make a fast-growing stock look overpriced when its premium is fully justified by growth.