Actualizado
• 7 min. de lectura (EN)
What Is Profit Margin? Formula, Sector Ranges, and Traps
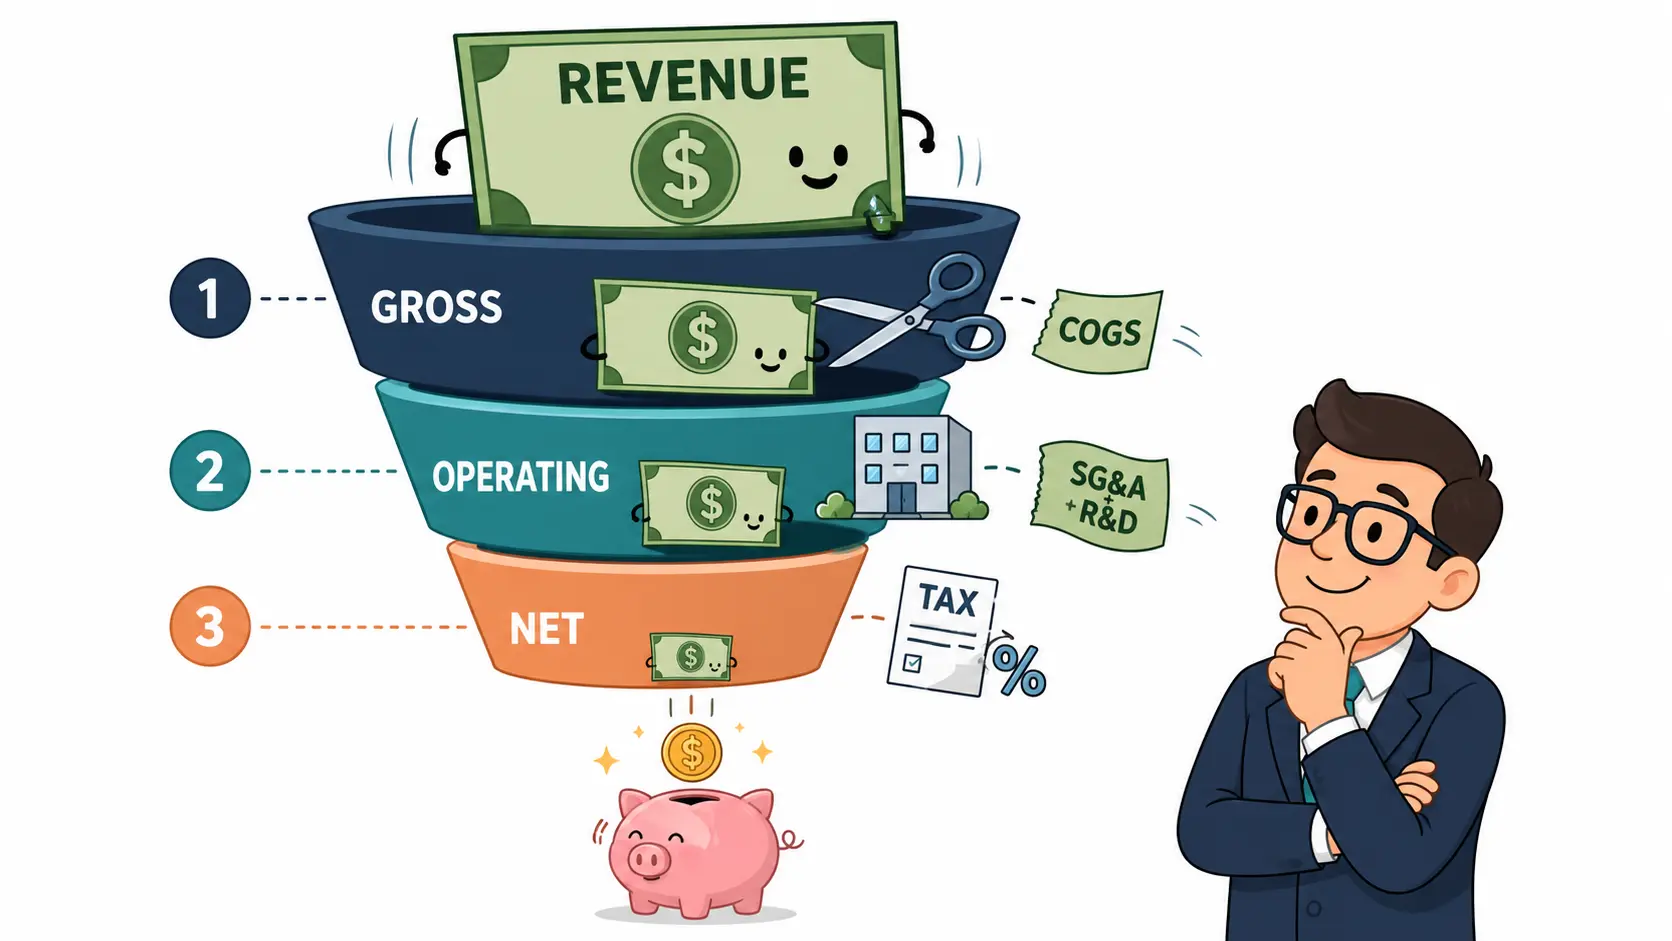
Profit margin is the share of every revenue dollar a company keeps as profit. Three tiers strip different layers: gross removes the direct cost of producing the goods, operating also removes the cost of running the business, net removes everything else including interest, taxes, and one-off items. Open the profit margin calculator on any income statement to see all three.
Why Profit Margin Matters
Each margin tier answers a different question. Gross margin reflects pricing power: a 70% gross margin says the unit economics work; a 10% margin says the business has to win on volume. Software runs high; retailers and automakers run low.
Operating margin reflects operating efficiency, since it captures whether the headquarters, sales force, and R&D budget are sized to the business. Two firms with identical 50% gross margins can split sharply on operating margin if one carries triple the SG&A.
Net margin is what shareholders actually see, after interest, taxes, and one-off items. The residual funds dividends, buybacks, and reinvestment.
The three together explain how revenue becomes profit. Apple's fiscal 2024 income statement is a clean example: $391B revenue, $180.7B gross profit (46.2%), $123.2B operating income (31.5%), $93.7B net income (24.0%). Each tier strips the next layer of cost; the gap between two tiers tells you what dominates the business.
Margin trends matter as much as the levels. Operating margin compressing two quarters in a row with revenue flat is the early read on pricing power slipping, ahead of the damage showing in headline profit.
How Profit Margin Works
The three formulas use the same numerator-over-revenue structure but pull a different income line.
Each formula deducts more cost than the one above it. Gross margin removes only Cost of Goods Sold. Operating margin also removes selling and administrative expenses, R&D, and depreciation tied to the business. Net margin removes everything else: interest, taxes, restructuring, and one-off items.
Worked example: Microsoft's fiscal 2024 income statement shows $245.1B revenue, $171.0B gross profit, $109.4B operating income, and $88.1B net income.
| Tier | Calculation | Result |
|---|---|---|
| Gross | $171.0B / $245.1B | 69.8% |
| Operating | $109.4B / $245.1B | 44.6% |
| Net | $88.1B / $245.1B | 35.9% |
The 25-point drop from gross to operating is the cost of running the business: $61.6B of operating expenses, mostly R&D, sales, and G&A. The 9-point drop from operating to net is interest, taxes, and small non-operating items.
Costco's fiscal 2025 inverts the shape entirely: gross margin 11.1%, operating margin 3.9%, net margin 2.9%. Costco starts with a thin slice and keeps most of it; Microsoft starts with a thick slice and gives up half.
Profit Margin by Sector
A 30% net margin is exceptional for a software firm and alarming for a utility, where regulators cap returns. Compare profit margin against the sector, never the broad market.
Damodaran's January 2026 sector dataset shows the spread.
| Sector | Gross | Operating | Net |
|---|---|---|---|
| Software | 71.7% | 33.0% | 25.5% |
| Semiconductor | 59.0% | 35.3% | 30.5% |
| Apparel | 56.9% | 9.1% | 3.9% |
| Air Transport | 24.8% | 5.3% | 2.5% |
| Auto & Truck | 10.4% | 2.3% | 1.3% |
| US Total Market (median) | 37.8% | 12.8% | 9.7% |
The relationship between the three tiers is sector-shaped. Apparel firms get to 57% gross margin on brand premiums and lose almost all of it to retail rent and marketing: net lands at 3.9%. Software and semiconductors start high and stay high because the marginal unit costs almost nothing to produce. Auto manufacturers operate on a 10% gross slice and almost nothing survives to net.
The pattern holds at company level. Microsoft (software) prints a 36% net margin in fiscal 2024. Walmart (mass retail) prints 2.9% on revenue 2.6 times the size. Both are well-run; both sit in their sector's normal range.
Where Profit Margin Misleads
The three tiers each carry a specific failure mode.
One-time items distort net margin: asset sales, restructuring charges, tax windfalls, and impairments all hit the bottom line without telling you anything about the underlying business. Tesla's fiscal 2023 net margin (15.5%) sat above its operating margin (9.2%) because of a $5B one-time deferred-tax-asset release. The underlying operating economics were already compressing. Read the cash-flow statement and the operating line before trusting the net number.
Gross margin alone misses capex: a high gross margin says the unit economics work, but if the business reinvests heavily to keep producing those units, the cash story can be far worse. A regulated utility on a 30% EBITDA margin looks like a software firm and runs nothing like one once recurring capex is counted.
Capitalising opex inflates apparent margin: costs that should hit the income statement get parked on the balance sheet as inventory or fixed assets. WorldCom did this in 2002 with $3.8B of operating-line expense. Reported operating margin rose without anything in the business changing.
Cyclical and seasonal mirages: a retailer's Q4 net margin says little about Q1. An automaker is the textbook cyclical company: at the cycle peak it prints record net margin a year before earnings collapse. Always pair the metric with cycle position when the business swings with the economy.
GAAP versus non-GAAP gap: tech firms routinely exclude stock-based compensation from non-GAAP margins, lifting the headline number by 5-15 points. Read the GAAP versus non-GAAP reconciliation, not the headline. SEC staff comments questioning non-GAAP definitions roughly doubled between 2023 and 2024.
Open the profit margin calculator on any income statement to see all three tiers in one pass. Combine the result with other stock fundamentals for the full picture of business quality.
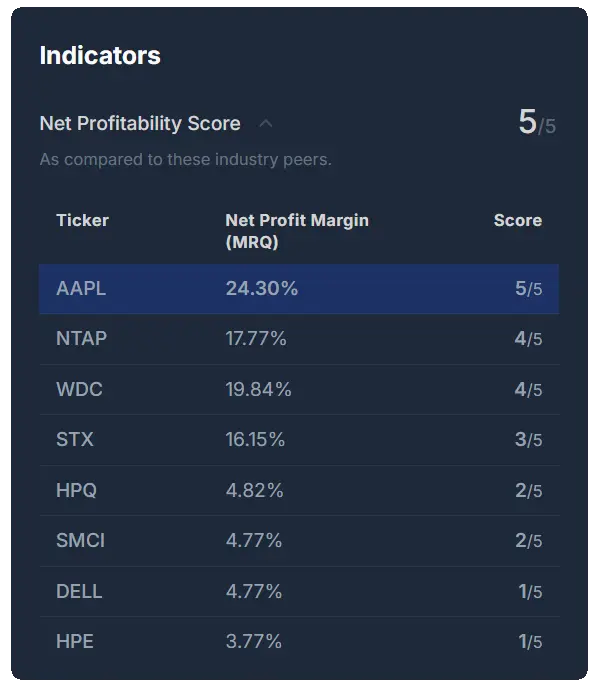
Ready to spot the most efficient companies?
Our Net Profitability Score instantly ranks every stock against its industry peers, so you can identify the best operators at a glance without manual comparison.
Frequently Asked Questions
What is the difference between gross, operating, and net profit margin? Gross margin strips out only the direct cost of producing goods or services, so it reflects how much headroom the core product leaves. Operating margin goes further and subtracts operating expenses like sales, research, and administration, showing how the day-to-day business performs. Net margin removes everything else, including interest, taxes, and one-off items, and is the figure most commonly quoted as "the" profit margin.
How does EBITDA margin differ from net profit margin? EBITDA margin divides earnings before interest, taxes, depreciation, and amortization by revenue, so it tries to isolate operating cash generation from financing and accounting choices. Net margin captures the full picture including those items, which matters because debt-heavy or capital-intensive companies look much healthier on EBITDA than on a net basis. Analysts use both: a wide gap between them usually points to heavy debt service or large non-cash charges.
Why do software companies have such high profit margins? Software is mostly a fixed-cost business: once the product is built, serving one more customer costs almost nothing. That structural advantage, combined with recurring subscriptions and low inventory needs, lets top software firms sustain operating margins that would be impossible in retail or manufacturing. It is one reason investors are willing to pay much higher valuation multiples for software than for asset-heavy industries.
Can profit margins stay high forever, or do they tend to shrink? Economic theory suggests high margins attract competitors that eventually compete them down, and history shows this happens in most industries over long horizons. Companies that defend strong margins for decades usually rely on a genuine moat such as network effects, switching costs, brand strength, or regulatory advantage. Watching whether margins hold up through competitive pressure is one of the best tests of how durable a business really is.