Updated
• 6 min read (EN)
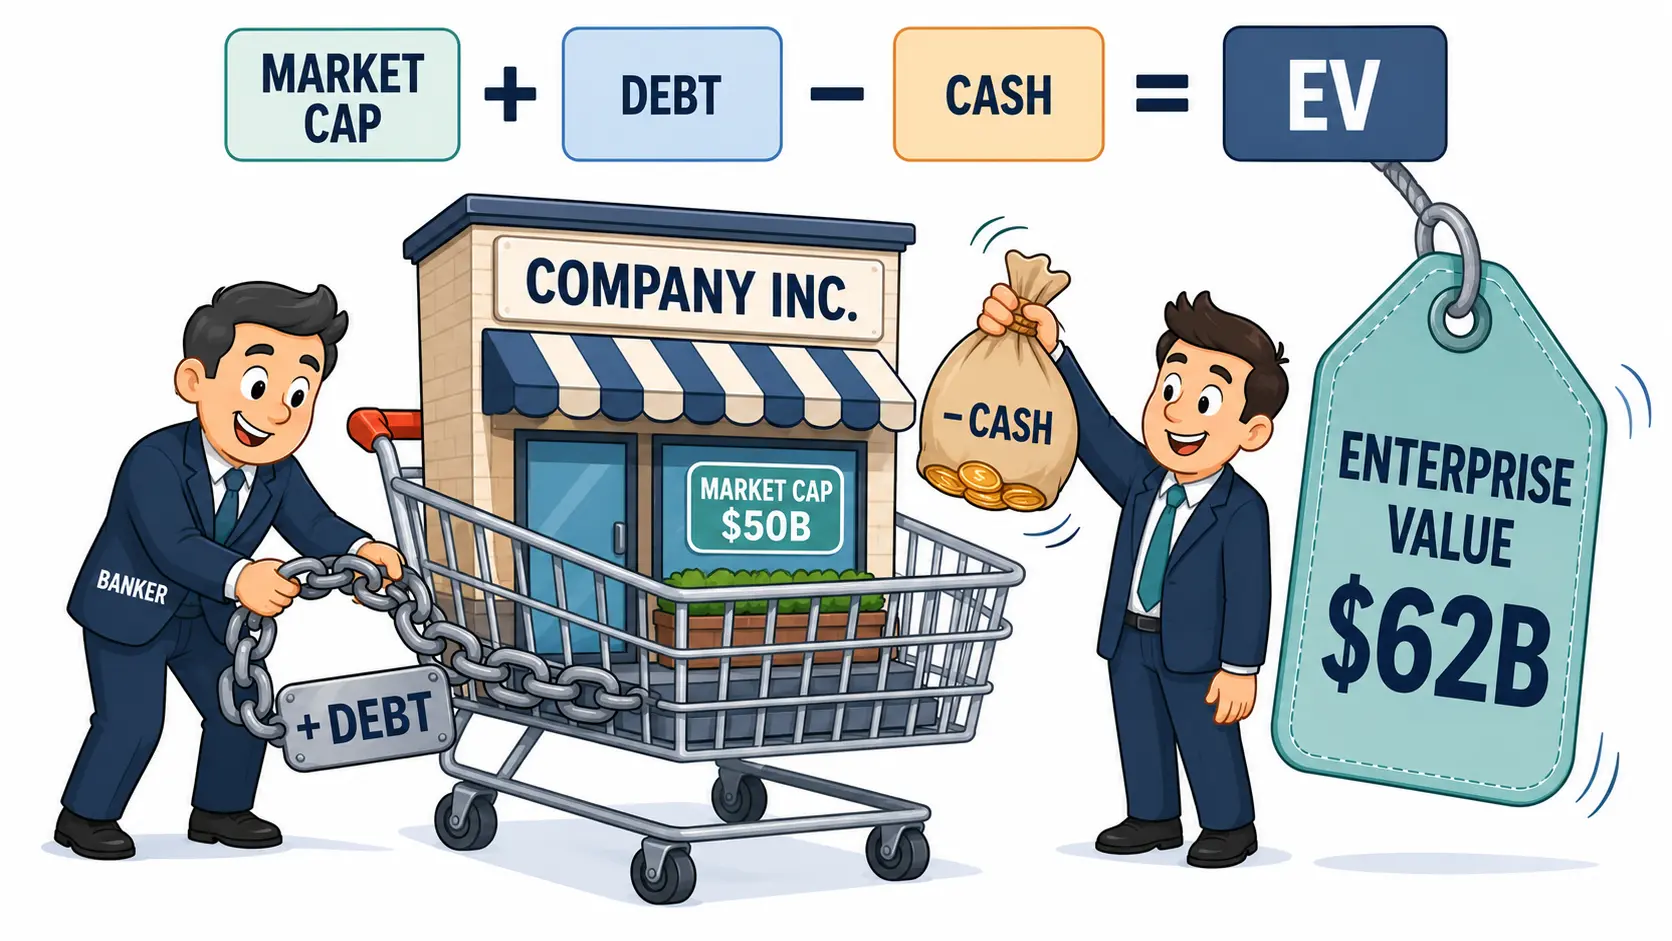
Market Cap vs Enterprise Value: The Real Buyout Price
Market cap measures what shareholders own. Enterprise value measures what it would cost to buy the whole company, debt included and cash credited back. Same business, two prices, often miles apart.
Run any company through the market cap calculator and you get the equity sticker. Enterprise value adds the rest of the bill.
Market Cap vs Enterprise Value at a Glance
| Dimension | Market Cap | Enterprise Value |
|---|---|---|
| Measures | Equity value of the company | Total takeover cost to all capital providers |
| Formula | Shares outstanding × share price | Market cap + total debt − cash + preferred stock + minority interest |
| Includes debt | No | Yes, added to the price |
| Includes cash | No | Subtracted from the price |
| Capital structure | Sensitive to leverage | Neutral to leverage |
| Fails when | Companies carry very different debt loads | Off-balance-sheet items or stale debt figures distort the number |
| Best for | Sizing equity stakes and index weighting | Comparing mixed capital structures and valuing acquisitions |
What Market Cap Tells You
Market cap multiplies share price by the number of shares outstanding. It answers one question: what is the equity worth if you bought every share at today's price?
A company with 1 billion shares trading at $50 has a market cap of $50 billion. That number drives index weighting, the small-mid-large cap classification, and most stock screener defaults.
Limitation: market cap ignores how the company is financed. Two firms with identical $10 billion market caps can sit on wildly different debt loads. The sticker reads the same. The purchases are not.
Example: Company A has a $10 billion market cap, no debt, and $2 billion in cash. Company B has a $10 billion market cap, $5 billion in debt, and $500 million in cash. Market cap calls them equals. The takeover bill tells a different story.
What Enterprise Value Tells You
Enterprise value asks a sharper question: if I bought the entire company outright, what is the real cost? The formula spells out every component:
EV = Market Cap + Total Debt − Cash and Equivalents + Preferred Stock + Minority Interest
Debt gets added because an acquirer either repays it or assumes it. Cash gets subtracted because the buyer takes that cash home and uses it to offset the purchase. Preferred stock and minority interest sit alongside debt as claims on the business that any buyer must settle.
Run Company A from above through the formula: $10B market cap + $0 debt − $2B cash = $8 billion EV. Now Company B: $10B + $5B − $0.5B = $14.5 billion EV. Two identical-looking stocks become an 81% gap once you count what a buyer actually pays.
Limitation: EV depends on accurate debt figures. Pension obligations and operating leases shift the number, and under IFRS 16 lease liabilities feed straight into EV.
When to Use Market Cap vs Enterprise Value
| Scenario | Better metric | Why |
|---|---|---|
| Index weighting | Market cap | Indices track equity ownership, not takeover cost |
| Same-sector peers with similar leverage | Market cap | Capital structure roughly cancels out |
| Cross-sector valuation | Enterprise value | Debt loads vary widely across industries |
| Capital-intensive sectors (telecom, airlines) | Enterprise value | High and uneven leverage distorts equity-only metrics |
| Acquisition or M&A analysis | Enterprise value | Buyers think in total cost, not share price |
| Equity multiples like P/E or P/S | Market cap | These ratios already use equity-side numbers |
| Operating multiples like EV/EBITDA or EV/Sales | Enterprise value | Both numerator and denominator cover the whole business |
Use market cap when: sizing your stake, ranking by size, or comparing similar firms in the same industry. It works as a proxy when leverage is comparable across the group.
Use enterprise value when: comparing companies with different debt levels, valuing acquisition targets, or running operating multiples like EV/EBITDA.
Using Market Cap and Enterprise Value Together
Neither number is wrong. They answer different questions, and serious stock analysis uses both.
Start with market cap to size the company. Then check the gap between EV and market cap. A small gap means the company is mostly equity-financed. A large gap signals heavy debt, large cash piles, or both.
When EV sits well above market cap, the company carries net debt the headline price hides. A $3 billion EV against a $2 billion market cap is a different risk than EV matching market cap.
When EV falls below market cap, the company holds more cash than debt. Some cash-rich firms have even traded at negative enterprise values during sharp drawdowns, where cash on hand exceeded the entire equity price plus borrowings. Rare, but it happens.
Combine market cap with EV-based multiples and a discounted cash flow valuation to get a complete picture. Equity multiples answer "what do shareholders pay." EV multiples answer "what does the business cost." Both views matter before committing capital. The side-by-side comparison guide shows where this pairing slots in next to cash, return, and earnings comparisons.
Pull the numbers for any ticker on the market cap calculator and check them against reported debt and cash to see the EV gap for yourself.
Frequently Asked Questions
Is enterprise value always higher than market cap? No. Enterprise value runs higher when the company carries more debt than cash, which is the common case. When cash exceeds total debt and other claims, EV drops below market cap. Cash-rich technology and biotech firms can sit in this position for long stretches.
Why do investors prefer enterprise value over market cap for valuation? EV is capital-structure neutral, so it lets you compare two companies with very different debt loads on equal footing. A leveraged firm and a debt-free one with the same market cap rarely cost the same to acquire. EV makes that gap visible, which is why M&A analysis runs on EV-based multiples.
What does a negative enterprise value mean? A negative EV means the company holds more cash than its market cap plus its debt and other claims combined. In theory a buyer would pay nothing and walk away with cash. It usually signals market pessimism or business problems, not a free lunch.
Does enterprise value include operating leases? Under IFRS 16 and the equivalent US GAAP standard, operating leases now appear as balance-sheet liabilities and flow into EV. Older filings that excluded them produced lower EV figures, worth checking when comparing against historical data.