Updated
• 11 min read (EN)
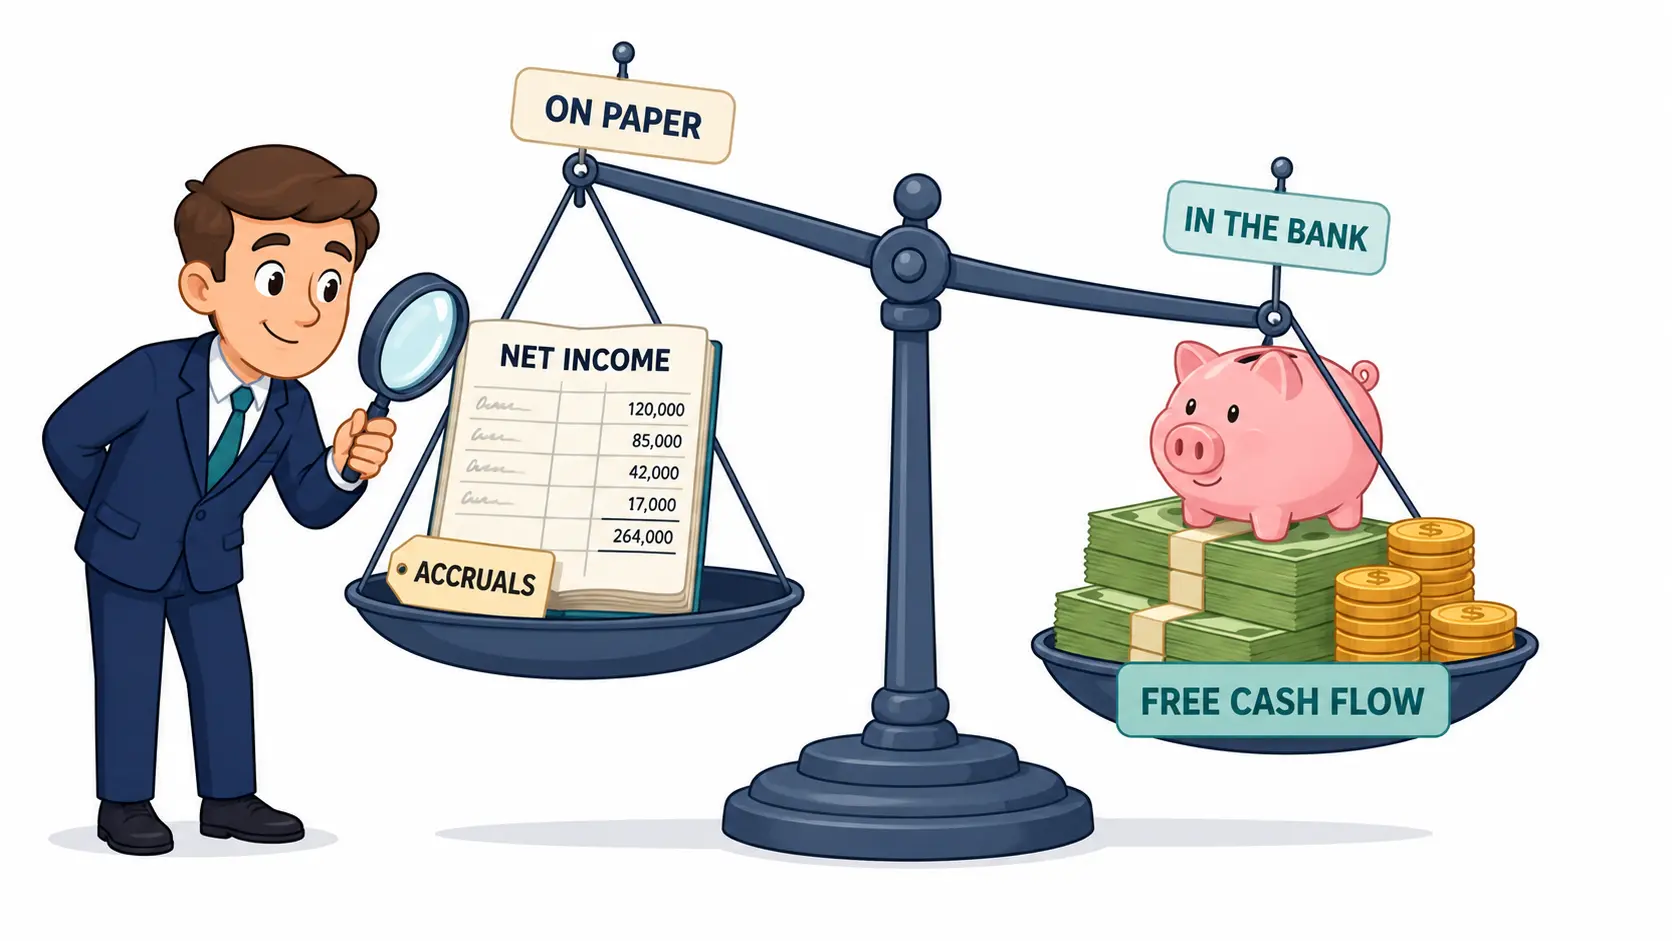
Net Income vs FCF: Which Number to Trust
Net income is accrual profit after every recognized expense, including non-cash charges. Free cash flow is the cash the business keeps after paying to maintain and expand itself. Both describe the same company in the same period and often disagree by billions. Net income answers "did the business earn a profit on paper?". FCF answers "did it generate cash you could spend?". Pair both inside the DCF calculator before deciding what a stock is worth.
Net Income vs FCF at a Glance
Net income sits at the bottom of the income statement under accrual accounting. Free cash flow is built from the cash flow statement, reversing the accruals back to cash.
| Dimension | Net Income | Free Cash Flow |
|---|---|---|
| Measures | Accrual profit after every recognized expense | Cash kept after capex and working capital |
| Formula | Revenue − COGS − OpEx − D&A − Interest − Taxes | Operating cash flow − capital expenditures |
| Lives on | Income statement | Cash flow statement |
| Non-cash charges | Subtracted (D&A, SBC, impairments) | Added back to reach cash |
| Working capital | Ignored | Subtracted when it grows, added when it shrinks |
| Capex treatment | Spread across years via depreciation | Hits the line in the year cash leaves |
| Best for | Peer ratios, EPS, GAAP comparability | Intrinsic value, dividend safety, debt paydown |
The gap between the two is the most useful diagnostic on a company's filings. A wide, persistent gap is where accounting choices, capex cycles, and earnings quality reveal themselves.
What Net Income Tells You
Net income is profit under accrual accounting: revenue is recorded when earned and expenses when incurred, regardless of when cash moves. The Financial Accounting Standards Board codifies the rules in US GAAP, and every public filer reports the same line under the same standards. That uniformity makes net income the backbone of cross-company comparison: earnings per share, price-to-earnings, return on equity, and most analyst forecasts run on net income.
Limitation: accruals require judgment. Revenue can be booked before cash arrives. Depreciation spreads a past outlay over years management chose. Bad-debt reserves, warranty provisions, and goodwill impairments rest on estimates. Net income is consistent across companies but not always close to economic reality.
Example: a retailer reports $200M net income on $2B revenue. Inside sit $60M of depreciation on stores already paid for, $30M of stock-based compensation that diluted shareholders without touching cash, and a $10M return provision that may not materialize. The income statement shows $200M of profit. The cash story differs.
What Free Cash Flow Tells You
Free cash flow is the cash a business produces after operating bills and the capex needed to keep running. Two flavors matter. Unlevered FCF (FCFF) is cash available to all capital providers and the standard DCF input. Levered FCF (FCFE) reaches equity holders after interest and scheduled debt service. Warren Buffett's owner-earnings concept, introduced in the 1986 Berkshire letter, is FCF with maintenance capex carved out from growth capex.
Limitation: FCF swings hard year to year. A quarter of heavy growth capex can flip a healthy business to negative FCF. Working capital releases can flatter a weak one. The number needs a 3-to-5 year normalization window. Stock-based compensation is a real cost: dilution does not appear in FCF because shares are not cash, but the long-term return to existing owners falls anyway.
Example: from 2010 to 2014 Amazon's net income drifted from a small profit to a $241M loss while operating cash flow nearly doubled to $6.8B. The income statement called the business marginal. The cash story called it a compounder.
When to Use Net Income vs FCF
The right number depends on the question. Multiples favor net income for comparability. Valuation, dividend coverage, and debt paydown run on FCF.
| Scenario | Better metric | Why |
|---|---|---|
| Peer comparison via P/E | Net income | GAAP rules make the denominator comparable across firms |
| Cross-period earnings trend | Net income | Accrual smoothing reveals operating direction |
| Software, asset-light services | Either, they converge | Capex is small; net income tracks cash closely |
| Capex-heavy (telecom, autos) | FCF | Depreciation lags real capex; net income flatters |
| Intrinsic DCF valuation | FCF (FCFF) | Discount cash, not accruals |
| Dividend safety check | FCF | Dividends come from cash, not reported earnings |
| Earnings-quality screen | Both, compared | Net income above FCF for years signals accrual buildup |
| High SBC tech firms | Net income | FCF understates the dilution cost paid to employees |
Use net income when: comparing a stock against peers, calculating ratios like P/E or return on equity, or tracking a multi-year trend where one-off capex would distort the picture. The audited GAAP figure is the only number lenders, regulators, and index providers accept as official.
Use FCF when: pricing the business on its own terms. A discounted cash flow valuation discounts FCF to present value. A dividend coverage check divides FCF by dividends paid. For capital-intensive sectors, net income flatters and FCF corrects. For asset-light firms the two run close.
Using Net Income and FCF Together
The two together reveal what one alone hides. The most reliable earnings-quality check is operating cash flow divided by net income, tracked over 3 to 5 years. Values near or above 1.0 say earnings are backed by cash. Values below 1.0 say accruals fill the gap, often a precursor to revision.
Return to the retailer. $200M net income, $290M operating cash flow ($60M depreciation and $30M stock comp added back), $120M capex on store refreshes. FCF lands at $170M. The income statement says 10% net margin. The cash story says 8.5% FCF margin.
The same logic flows into profit margin analysis. A 20% net margin on a capex-heavy industrial often becomes a single-digit FCF margin once sustaining capex is paid. A 25% net margin at a software firm often becomes 30% once depreciation is added back and capex stays small.
Both share buybacks and dividends come from FCF, not net income, so payout ratios should be checked against cash. The stock metric comparisons guide lines net income vs FCF up next to the pairings every full analysis needs. The same split explains why a stock can look cheap on non-GAAP P/E and expensive on P/FCF, one rung up from the GAAP vs non-GAAP debate.
Run net income alongside FCF inside the DCF calculator to see which number the market is pricing.
Frequently Asked Questions
Why is free cash flow often higher than net income? Net income deducts depreciation and amortization, both non-cash charges that never leave the bank account. Free cash flow adds them back and then subtracts only actual capex. For a mature business where annual capex sits below annual depreciation, free cash flow lands above net income. Stock-based compensation works the same way: it lowers reported profit without touching cash.
Can a company have positive net income and negative free cash flow? Yes, and it is common during heavy investment phases. A retailer can post $500M of net income while spending $800M on new stores, producing negative free cash flow that year. Growing receivables and inventory pull cash out of the business the same way. The question is whether the spending creates future earnings or covers operating shortfalls.
Which is harder to manipulate, net income or free cash flow? Free cash flow is harder, but not impossible. Net income relies on accrual estimates, including revenue recognition timing, asset useful lives, and bad-debt reserves. Free cash flow can still be flattered by stretching payables, classifying recurring costs as capex, or selling receivables. The cash flow statement is closer to reality than the income statement, but neither number is immune.
Should I use net income or free cash flow for valuation? Use free cash flow for intrinsic valuation through a discounted cash flow model. Use net income, or earnings per share, for the price ratios that compare a stock against its peers. The two answer different questions: what is this business worth on its own, and what is the market charging today versus similar companies.