Published
• 10 min read (EN)
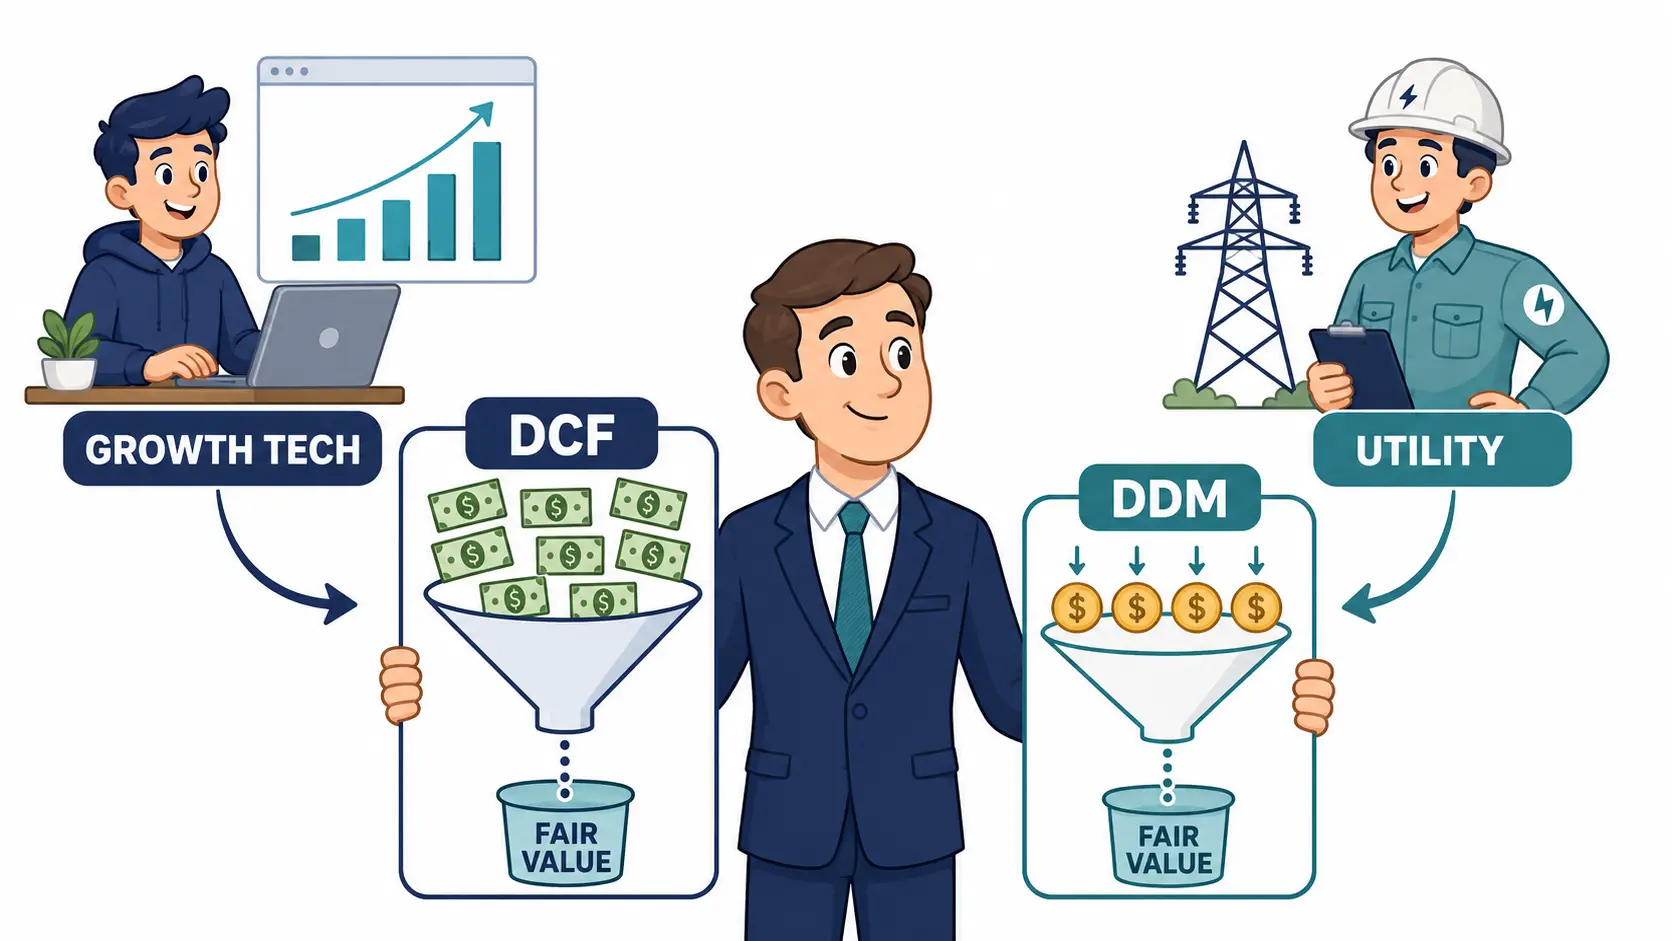
DCF vs DDM: Which Valuation Model Fits Which Stock
DCF discounts every dollar of free cash flow the business produces. DDM discounts only the slice paid out as dividends. The model that fits a stock is the one whose cash flow matches how the company returns money to owners. Start with the dcf calculator when the company keeps and reinvests most of what it earns; reach for DDM when the dividend is a reliable proxy for owner cash.
DCF vs DDM at a Glance
DCF works on free cash flow before any payout decision. DDM works on the dividend the company actually pays. Both discount future cash to present value: they just discount different cash.
| Dimension | DCF (Discounted Cash Flow) | DDM (Dividend Discount Model) |
|---|---|---|
| Discounts | Free cash flow (FCFF or FCFE) | Dividends per share |
| Formula core | EV = Σ FCF / (1+WACC)^t + TV | V = D₁ / (r − g) for constant growth |
| Discount rate | WACC for FCFF, cost of equity for FCFE | Cost of equity |
| Output | Enterprise or equity value | Equity value per share |
| Best for | Non-payers, growth firms, full-cash view | Mature payers with stable dividend policy |
| Falls apart on | Negative FCF, early-stage, banks | Non-payers, unstable payouts, high growth |
| Used by | About 87% of practising analysts | About 35%, mostly for income sectors |
What DCF Tells You
A discounted cash flow model values a business as the sum of every future free cash flow, shrunk back to today's dollars. It assumes you receive the cash the business produces, whether management hands it to you or keeps it inside.
Two flavors matter. Unlevered FCF (FCFF) is cash to all capital providers, discounted at WACC, producing enterprise value. Levered FCF (FCFE) is cash to equity only, discounted at the cost of equity, producing equity value directly. Most practitioners run FCFF and back out equity by subtracting net debt.
Limitation: The discount rate dominates the answer. A 1 percentage point change in WACC can shift fair value by 15% to 25% in a 10-year model, and terminal value typically represents 60% to 80% of the total. Most of the answer lives in the part hardest to defend.
Example: A firm produces $1B in free cash flow, grows at 6% for 10 years, with a 9% WACC and 3% terminal growth. The explicit 10-year cash flows discount to roughly $8.6B in present value. Terminal value, computed as year-11 FCF divided by (9% − 3%) and discounted back to today, adds about $13.4B. Enterprise value lands near $22B. Subtract net debt to get equity.
What DDM Tells You
The dividend discount model values a stock as the sum of every future dividend, discounted at the required return on equity. The single-stage gordon growth model is the shortcut: V = D₁ / (r − g), where D₁ is next year's dividend, r the cost of equity, and g the long-run dividend growth rate.
DDM assumes the dividend is the cash the shareholder receives. It fits when payout ratios are stable, growth is steady, and the gap between r and g is wide enough to keep the math grounded. For minority shareholders with no control over payout policy, DDM cleanly values the slice they can claim.
Limitation: Input sensitivity bites hard. A 1 percentage point shift in g can swing the result by 15% to 50%, because the (r − g) denominator is small to begin with. DDM also misses companies that return cash through share buybacks instead of dividends.
Example: A regulated utility pays $3.00 next year, grows the payout at 4%, with an 8% cost of equity. V = 3.00 / (0.08 − 0.04) = $75 per share. Push growth to 5% and V jumps to $100, a 33% swing on a single-input change.
When to Use DCF vs DDM
Each model fits a different cash-flow shape. The table pairs the stock with the model that gives the cleaner answer.
| Stock type | Better model | Why |
|---|---|---|
| Tech, biotech, growth (no dividend) | DCF (FCFE/FCFF) | No dividend to discount; FCF carries the full cash story |
| Regulated utilities | DDM | Stable payout policy, predictable g, payout near FCFE |
| Consumer staples (mature payers) | DDM or DCF | Either works; pair them for a cross-check |
| REITs | DDM | Required to distribute most income; dividend = owner cash |
| Banks and insurers | DDM | Capex and working capital break a normal DCF |
| Cyclicals (autos, airlines, semis) | DCF (normalized) | Use mid-cycle FCF; dividends swing too much for DDM |
| Capital-light compounders | DCF | Buybacks plus dividends; DDM misses half the payout |
Use DCF when: the company is non-paying, growing fast, or returns cash mostly through buybacks. Also use DCF when payout ratios swing year to year or when the dividend is a small fraction of free cash flow to equity.
Use DDM when: the dividend is stable, the payout ratio matches the free cash flow paid out, and the business is mature. Utilities, REITs, and consumer staples sit in this zone. Coca-Cola has raised its dividend for over 60 consecutive years; Procter & Gamble for more than 65. Both are textbook DDM candidates.
Use a reverse dcf check when: you want to know what growth the market has already priced in before committing to either model.
Using DCF and DDM Together
The strongest case is to run both, then compare. For a mature payer, DCF on FCFE and DDM should land within 10% to 20% of each other. A larger gap is a signal. If DCF says the stock is worth more than DDM, the company is reinvesting at lower returns than the market demands, or hoarding cash. If DDM says it is worth more than DCF, the dividend is being funded from sources other than free cash flow: debt, asset sales, or a payout ratio above what underlying cash supports.
The combined read also catches policy risk. A high-yield stock cheap on DDM but expensive on DCF often has a dividend the cash flow cannot sustain. A compounder cheap on DCF but absent on DDM only suits owners patient enough to wait for a payout cycle that may never start. Compare both alongside the toolkit in our stock metric comparisons guide, then plug your assumptions into the dcf calculator to see how the fair value range moves under each set of inputs.
Frequently Asked Questions
Which is more accurate, DCF or DDM? Neither is more accurate in general. DCF fits businesses where free cash flow is the cleanest read on what the company produces. DDM fits mature payers where the dividend is a reliable proxy for owner cash. Run the model whose inputs you can defend. A precise model built on the wrong cash flow series is worse than a rough model built on the right one.
Can I use DDM on a stock that pays no dividend? Not directly. DDM needs a dividend to discount. For non-payers, use a free cash flow DCF, or a free cash flow to equity model that values the cash the company could pay if it chose to. A common workaround is the total payout model, which adds buybacks to dividends and treats the sum as the cash returned to shareholders.
Why do analysts use DCF instead of DDM for most public companies? Most listed companies either do not pay dividends or pay out far less than they could afford. DCF captures the full cash a business produces, not just the portion management chose to distribute. Surveys of practising analysts show free cash flow models in use roughly twice as often as DDM, with DDM held in reserve for utilities, consumer staples, and some financial firms.
Do DCF and DDM give the same answer for a mature dividend payer? They converge when dividends equal free cash flow to equity, which is roughly true for utilities and some consumer staples. The two answers drift apart when payout ratios are below 75% of free cash flow to equity or above 100% of it. If your DCF and DDM disagree by more than 20%, the dividend policy is doing real work and is worth examining on its own.