• 7 min. de lectura
Dividend Yield Heatmap: Find the Highest-Paying Dividend Stocks Instantly
Scrolling through hundreds of stocks to find solid dividend payers wastes time. Here's how to spot the best income opportunities in seconds.
What is a dividend yield heatmap?
A dividend yield heatmap visually displays which stocks pay dividends and ranks them by yield percentage, letting you instantly identify the highest-paying dividend stocks in any index or category.
Heatmaps transform hours of manual screening into seconds of visual pattern recognition, showing you exactly where the income opportunities are.
What are dividend stocks?
Dividend stocks are companies that regularly distribute a portion of their profits to shareholders as cash payments. These payments (called dividends) provide investors with:
- Regular income: Quarterly or annual cash payments regardless of stock price movements
- Compounding potential: Reinvested dividends can dramatically increase long-term returns
- Downside cushion: Income helps offset losses during market downturns
The catch? Not all dividend-paying stocks are created equal. Some offer sustainable yields backed by strong cash flow, while others pay unsustainably high dividends that signal financial distress.
How to read dividend yield heatmap visual encoding
Our dividend yield heatmap uses visual properties to communicate yield data instantly:
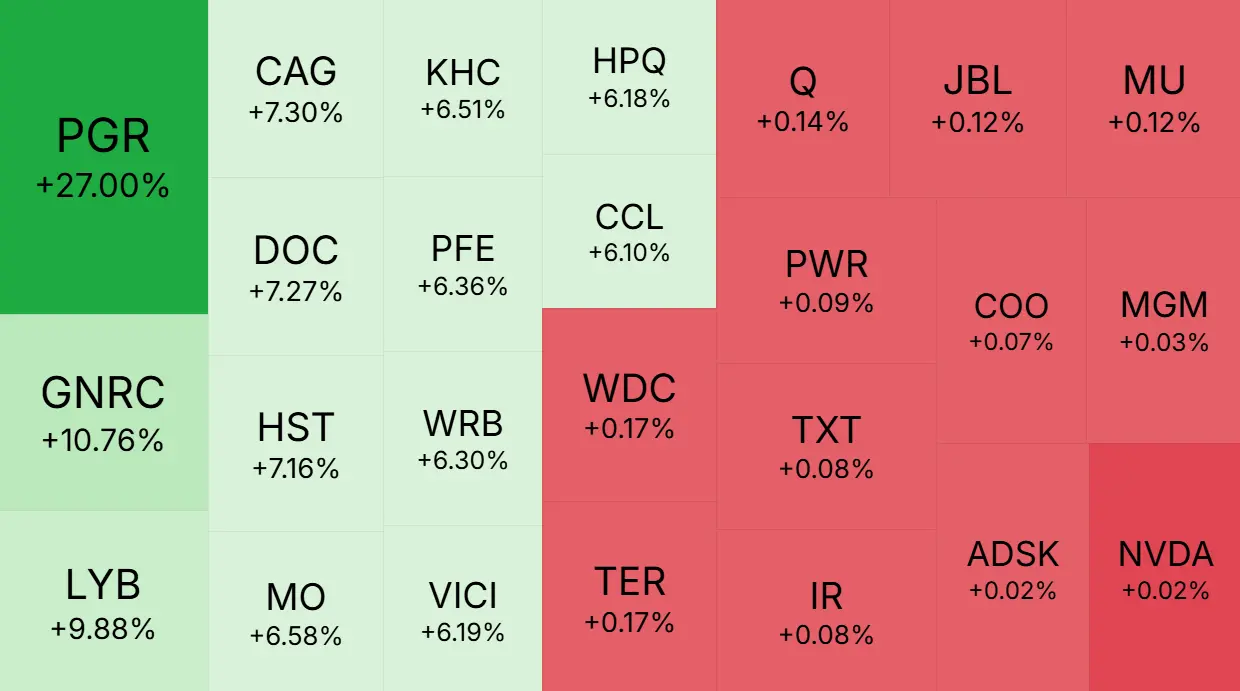
Color intensity shows yield strength. Deeper, more intense colors indicate higher dividend yields. The color spectrum reveals which stocks offer the strongest income opportunities at a glance.
Tile size shows yield extremes. The largest tiles represent both the highest yields and the lowest yields. Median-sized tiles show average yields. This makes outliers at both ends immediately visible.
Dividend yields typically fall into these ranges:
- Below 2%: Low yield (growth stocks or companies retaining capital)
- 2-4%: Moderate yield (balanced dividend payers)
- 4-6%: High yield (attractive income opportunities)
- Above 6%: Very high yield (requires investigation)
Formula
Dividend yield is calculated by dividing the annual dividend payment per share by the current stock price, then multiplying by 100 to get a percentage.
Example
This example shows how two stocks with the same dividend payment can have dramatically different yields.
| Company | Stock Price | Annual Dividend | Dividend Yield |
|---|---|---|---|
| Company A (Higher yield) | $50 | $3.00 | $3.00 ÷ $50 = 6.0% |
| Company B (Lower yield) | $100 | $3.00 | $3.00 ÷ $100 = 3.0% |
Key insight: Both companies pay the same $3 dividend, but Company A delivers double the yield because its stock price is lower.
This shows why yield percentage matters more than absolute dividend amount when comparing income opportunities.
How to find out if a stock pays dividends and discover dividend yield
Traditional screening methods require checking each stock individually, a time-consuming process when analyzing hundreds of companies. Our dividend yield heatmap displays only dividend-paying stocks from major indices like the S&P 500, Nasdaq 100, or favorite superinvestor portfolios like Warren Buffett's holdings.
Here's how to find dividend yield effectively:
Step 1: Choose your universe: Select S&P 500, Nasdaq 100, or superinvestor portfolios to narrow your focus based on your investment philosophy.
Step 2: Adjust the filter: Set the display to show top 10, 20, or 50 dividend payers to focus on the highest-yield opportunities.
Step 3: Scan for visual prominence: Look for the largest tiles and deepest colors. These represent the highest-yielding stocks in your selected universe.
Step 4: Click to investigate: Each tile links directly to detailed stock analysis where you can verify payout sustainability and business fundamentals.
The visual format reveals patterns impossible to spot in spreadsheets: yield concentration, market-wide dividend trends, and which stocks legendary investors favor for income.
Using heatmaps to discover the best dividend stocks
The heatmap excels at revealing opportunities traditional screeners miss:
Instant yield comparison: See how every dividend payer ranks against its peers through visual prominence. No manual sorting required.
Superinvestor insights: When viewing portfolios like Warren Buffett's, the heatmap reveals which holdings he favors for dividend income versus growth.
Market opportunity signals: If the largest tiles cluster around 4-6% yields, the market is offering balanced income opportunities. Concentration above 8% may signal exceptional value or sector-wide distress worth investigating.
Why dividend yield matters for income investors
Dividend yield directly determines your income return independent of stock price changes. Consider this comparison:
Investment A: $10,000 invested at 3% yield = $300 annual income
Investment B: $10,000 invested at 6% yield = $600 annual income
Investment B generates double the annual income from the same capital, regardless of whether stock prices rise or fall.
This explains why income-focused investors prioritize yield: it provides predictable cash flow that compounds over time through reinvestment.
The dividend yield trap
High yields can mislead investors. Here's where many fail:
- The Dividend Cut Trap: A 10% yield often signals the market expects a dividend reduction. Always verify payout ratios and cash flow sustainability.
- The Size Illusion: The heatmap's largest tiles represent extreme yields (both highest and lowest), but size doesn't indicate safety. A massive tile might show an 8% yield signaling distress, or a 0.5% yield from a growth stock. Always investigate why yields are exceptionally extreme.
- The Declining Business Trap: High yields sometimes result from falling stock prices rather than generous dividends. Check whether the stock price is dropping faster than dividends are growing.
Tips for smart dividend investing
Effective dividend investing requires more than chasing the highest yields:
Verify sustainability: Check payout ratios (dividends ÷ earnings). Ratios above 80% suggest limited room for dividend growth.
Examine growth trends: Companies that consistently increase dividends often signal strong business fundamentals.
Compare across indices: Use different heatmaps (S&P 500, Nasdaq, superinvestor portfolios) to find where the best risk-adjusted yields currently exist.
Monitor for changes: Use the heatmap regularly to spot tiles shrinking in size. This visual change may signal declining yields or business deterioration.
Balance yield with quality: A reliable 4% yield beats an unsustainable 8% yield that gets cut in half.
The bottom line
The dividend yield heatmap answers a critical question: "Where can I find sustainable income opportunities right now?"
Before manually screening hundreds of stocks, use the heatmap to instantly identify the highest-paying dividend stocks. You might discover that apparent bargains are actually dividend cut candidates, or that overlooked opportunities hide in plain sight.
This is how you find income opportunities without wasting hours on manual research.
Frequently Asked Questions
What is a good dividend yield percentage?
A good dividend yield typically falls between 2-6%. Yields below 2% suggest growth-focused companies retaining capital. Yields of 2-4% represent moderate, balanced payers. Yields of 4-6% indicate attractive high-yield opportunities. Yields above 6% require investigation to confirm sustainability and rule out financial distress.
How do I find stocks that pay dividends?
Use a dividend yield heatmap to visually identify all dividend-paying stocks in major indices like the S&P 500 or Nasdaq 100. The heatmap filters out non-dividend payers automatically, showing only companies that distribute cash to shareholders. Larger tiles and deeper colors indicate higher yields.
How to calculate dividend yield?
Dividend yield equals annual dividend per share divided by current stock price, multiplied by 100. For example: A stock trading at $50 that pays $3 annually has a 6% yield ($3 ÷ $50 × 100 = 6%). This percentage tells you how much income you earn per dollar invested.
Are high dividend yield stocks safe?
High dividend yields are not automatically safe. Yields above 8-10% often signal market expectations of a dividend cut or underlying business problems. Always verify payout ratios (dividends ÷ earnings) stay below 80%, examine cash flow sustainability, and confirm the company isn't cutting dividends to maintain artificially high yields.
What is dividend yield forward?
Dividend yield forward uses projected future dividend payments instead of historical payments. This forward-looking metric helps investors evaluate expected income based on announced dividend increases or company guidance, providing a more current view than trailing twelve-month yields.
Ready to find high-yield dividend stocks? Explore the S&P 500 Dividend Yield Heatmap to discover income opportunities instantly.