• 7 min. leestijd (EN)
What Is a Value Trap? 7 Warning Signs Investors Miss
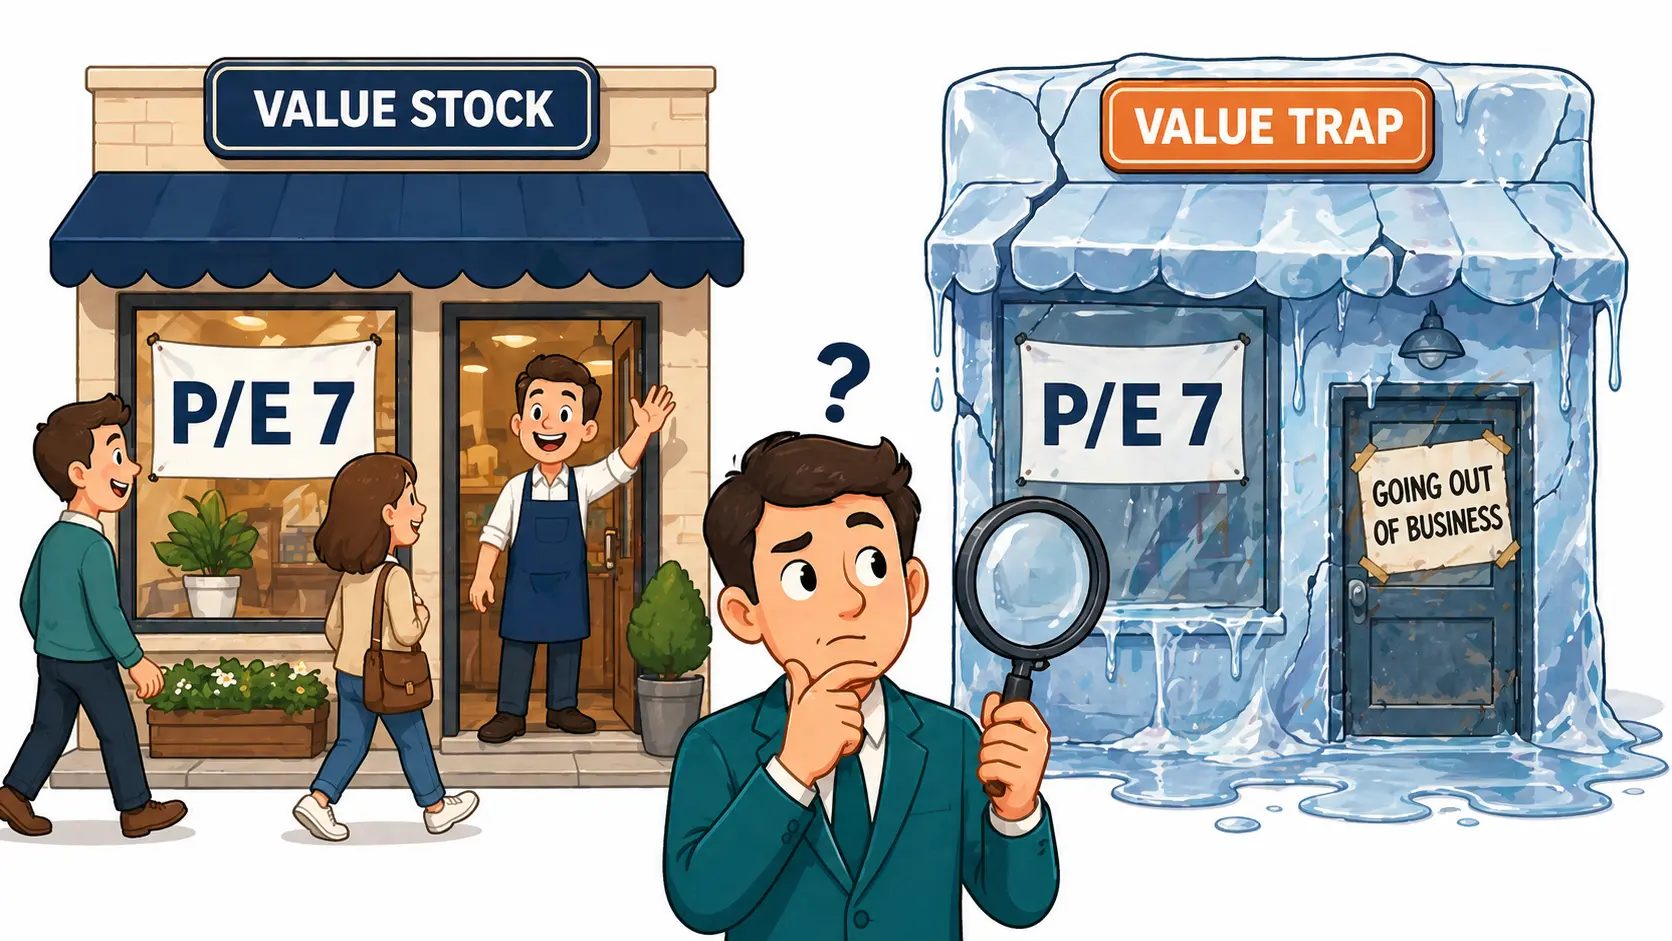
A value trap is a stock that looks cheap on standard metrics (low P/E, high dividend yield, low price-to-book) but stays cheap because the business behind the metrics is in structural decline. The signal looks identical to a real bargain. The outcome is the opposite.
Open the dividend yield heatmap to see where the cheapness signal is most visible: the highest yields in the market are exactly where the trap forms first.
Why a cheap stock can keep getting cheaper
Cheap is not the same as undervalued. Two stocks can trade at a P/E of 7. One is a great business going through a temporary problem and recovers. The other is a melting ice cube the market correctly priced for terminal decline. The metric does not tell you which is which.
The mental shift that separates value investors from value-trap victims is moving from "how cheap is this?" to "why is this cheap?" The answer needs to come from the business, not the screener.
The growth vs value distinction sets up the difference between value and growth investing, but value traps live in a third category: cheap stocks where the cheapness is justified.
7 warning signs of a value trap
The strongest single tell is rarely one warning sign on its own. It is two or three of these stacking together.
- Declining revenue. A company that cannot maintain its top line is losing customers, share, or market.
- Compressing profit margins. Falling gross or operating margins reveal lost pricing power or rising costs the company cannot pass through.
- Eroding moat. A competitive advantage that used to defend pricing is breaking. New entrants, technology shifts, or substitution erode the protection.
- Industry in structural decline. Even a well-run business in a shrinking industry is fighting gravity. Newspapers, traditional cable, and mall-based retail are textbook cases.
- High debt with low cash flow. A cheap multiple on top of heavy debt is a lethal combination. Interest payments swallow what little operating cash remains.
- Dividend yield from a price crash, not a raise. A yield that jumps from 4% to 10% because the stock fell 60% is the market pricing in a cut, not a generous payout.
- Share buybacks crowding out reinvestment. When a struggling business spends more on buying back stock than on research and development, leadership has stopped trying to fix the underlying problem.
The yield trap: the most common value trap
A high dividend yield is a magnet for income investors and the most visible value-trap surface. The yield calculation is simple: annual dividend ÷ stock price. When the stock collapses, yield rises mechanically. The dividend has not changed, but the denominator has.
That is not a real income opportunity. It is a warning. Check the payout ratio (dividends ÷ earnings) before treating any high yield as sustainable. A payout ratio above 80% leaves no buffer for an earnings dip. Above 100% means the dividend is being paid from cash on hand, not from current profits.
A heatmap that surfaces the highest yields visually is exactly where the yield-trap discipline matters most. Treat the largest yield tiles as candidates for investigation, not as a buy list.
Earnings quality: the strongest single filter
Reported earnings can be flattered with accounting choices. Cash is much harder to fake, which is why value-trap screening leans on cash quality.
Watch for growing reported earnings but flat or declining free cash flow. The gap between the two is where accounting accruals live. Real businesses convert earnings to cash; deteriorating ones report earnings but cannot deliver cash.
Also watch return on invested capital (ROIC). A multi-year decline in ROIC means each new dollar the business invests earns less than the last one. The cheapness is the market noticing what the income statement is hiding.
Famous value traps and what they teach
Sears. Eddie Lampert prioritized share buybacks and financial engineering over store investment and online operations. The business decayed for a decade as metrics flattered the stock. Bankruptcy followed in 2018.
Kodak. A photography monopoly that watched digital arrive and refused to cannibalize its own film business. Bankruptcy in 2012.
GE. Decades of "earnings consistency" masked declining ROIC, accumulating debt, and value-destroying acquisitions like the $10.6B Alstom deal. The stock looked cheap throughout the slow unwind.
BlackBerry. Investors who bought at a sub-13 P/E in 2010 watched the iPhone take the smartphone market. The stock lost roughly 80% over the next seven years.
The Buffett mental model: valuation last
Disciplined value investors who cite Buffett put valuation at the end of the analysis. The order: moat, reinvestment runway, cash flow and balance sheet, management's capital allocation, and only then valuation.
The implicit claim: a cheap stock with a deteriorating moat is more dangerous than a fairly priced stock with a durable one. Valuation discipline sits on top of a quality filter.
For valuations stuck at the cheap end of their history, the PEG ratio helps separate cheap-because-growing-slowly from cheap-because-broken. Both can show low P/E, but PEG corrects for growth. A negative or elevated PEG on a low-P/E stock is the trap signature.
How to verify before you buy
Before adding any cheap-looking stock, walk this checklist.
- 5-year ROIC trend. Stable or rising means the moat is intact. Declining is the strongest single warning.
- Free cash flow versus reported earnings. Cash conversion above 80% is healthy. Below 60% with rising earnings is the red flag.
- Revenue and margin trajectory. Two consecutive years of declines on either is enough to require a structural-change thesis before buying.
- Industry direction. Is the broader market growing, flat, or shrinking? A cheap stock in a shrinking industry needs a rare reason to recover.
- Capital allocation. Buybacks at peak prices, dividends funded by debt, and outsized acquisitions during operational decline all signal management has run out of better options.
Then, and only then, check the P/E ratio. A low multiple on a business that passes every check above is a real opportunity. A low multiple on a business that fails any of them is a value trap waiting to spring.
If you scan for income, the S&P 500 dividend yield heatmap is where the highest-yield candidates surface, which is exactly the universe where the yield-trap discipline matters most.
Frequently Asked Questions
What is the difference between a value stock and a value trap? A value stock is a fundamentally healthy business trading below its intrinsic value because of a temporary problem the market is mispricing. A value trap looks identical on the same metrics, but the cheapness reflects permanent decline. The signal is the same: the business reality determines which it actually is.
Can a value trap ever recover? Yes, but it requires a real change in the business: new management, a product reinvention, an industry shift back in its favor, or a major acquisition that actually works. Pure financial engineering does not rescue a value trap. Recovery is rare enough that ignoring the warning signs is the higher-percentage play.
Why is a high dividend yield often a yield trap? Yield rises mechanically when a stock price falls, even if the dividend has not been raised. So the most visually striking yields often come from price collapses rather than dividend hikes. Verify the payout ratio and check whether the dividend has been growing before treating any high yield as a real income opportunity.
Which single metric is most reliable for spotting a value trap? A multi-year decline in return on invested capital (ROIC) is the strongest single tell. ROIC measures whether each new dollar the business invests is generating profit. When ROIC falls year over year, the moat is shrinking and the business is consuming capital it cannot deploy productively, regardless of what the income statement reports.