Updated
• 10 min read (EN)
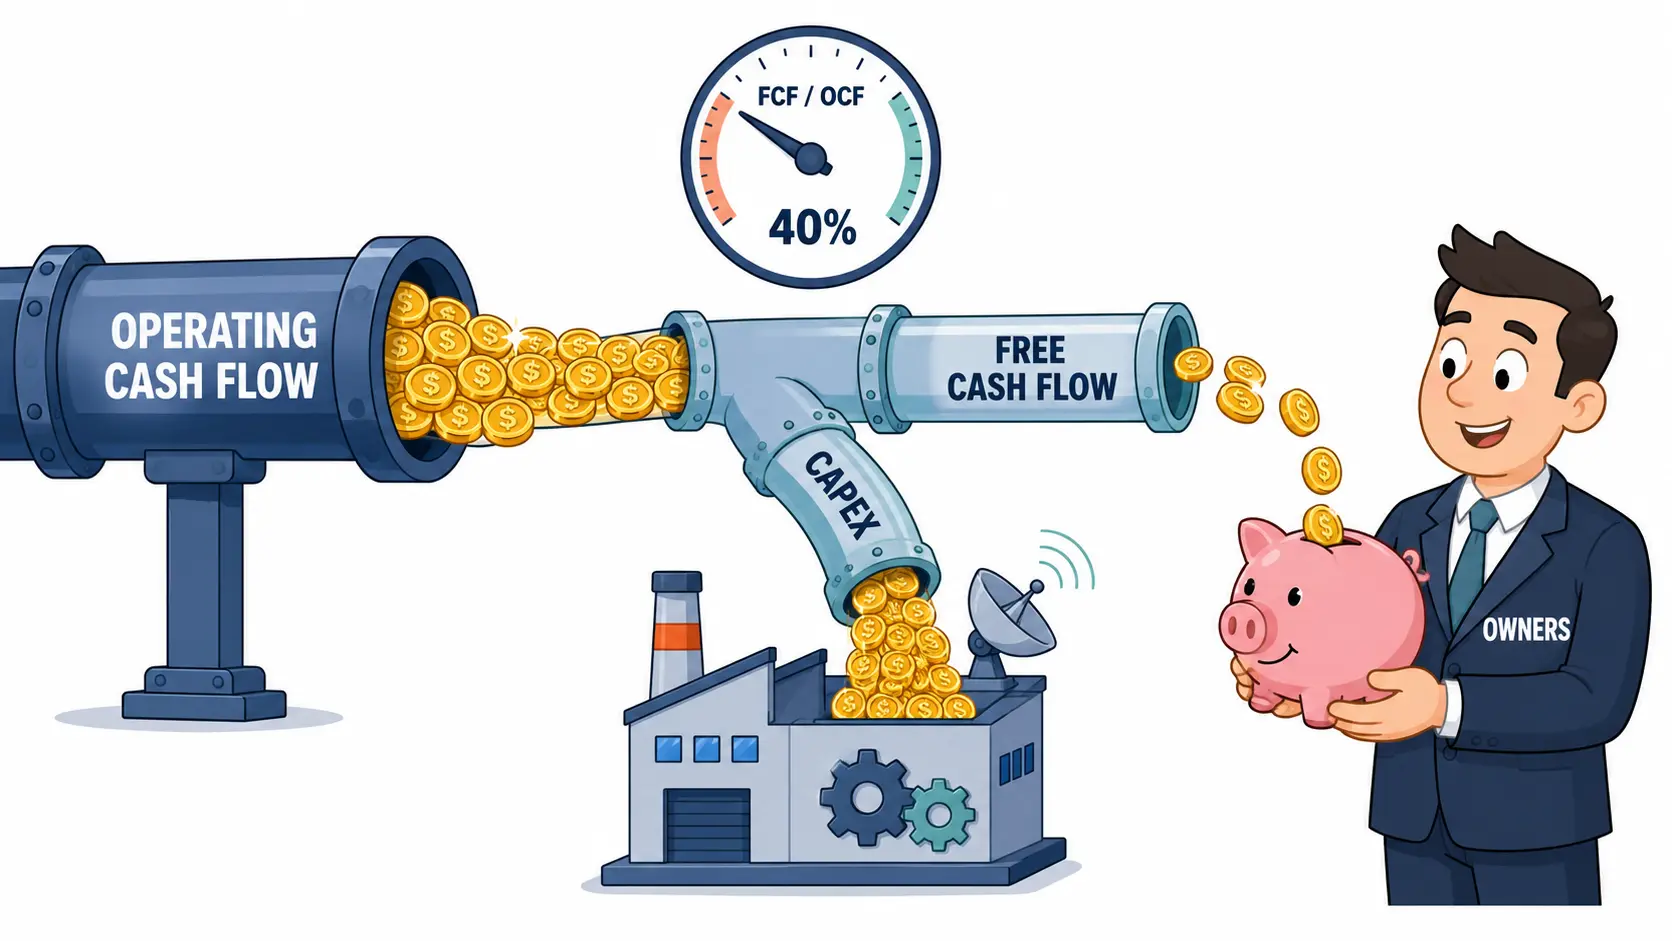
Operating Cash Flow vs FCF: Real Cash After Capex
Operating cash flow shows what the business generates from core operations. Free cash flow subtracts the capex needed to keep it running. OCF starts the cash story; FCF finishes it. The gap is capex, which is why two firms posting identical operating cash flow can leave shareholders with very different amounts of real money. Both numbers feed a discounted cash flow valuation, where capex separates an attractive operating margin from a viable investment.
OCF vs FCF at a Glance
Operating cash flow sits at the top of the cash flow statement. Free cash flow is one subtraction further down. The table pins what each measures, the formula, and the question each answers.
| Dimension | Operating Cash Flow | Free Cash Flow |
|---|---|---|
| Measures | Cash from core operations | Cash left after reinvestment |
| Formula | Net income + D&A ± working capital | Operating cash flow − capex |
| Includes capex | No | Yes, subtracted |
| Working capital | Yes, every swing hits the line | Yes, inherited from OCF |
| Volatility | Smoothed by accruals | High, especially capex-heavy firms |
| Used in | Earnings-quality ratios | DCF valuation, FCF yield, dividend cover |
| Best for | Judging operating health | Judging cash returned to owners |
What Operating Cash Flow Tells You
Operating cash flow takes net income and reverses everything accrual accounting hides. Add back depreciation and amortization (D&A), since neither is a cash expense. Add back stock-based compensation, since it dilutes shareholders without leaving the bank account. Adjust for working capital changes: receivables, inventory, and payables move cash without changing reported earnings.
That mechanic makes OCF the cleanest read on whether the income statement reflects real money. A profitable business that cannot collect from customers shows up here first. The OCF / net income ratio is the standard earnings-quality screen: under 1.0 sustained for several years signals trouble even when reported profits keep climbing.
Limitation: OCF ignores the capital cost of staying in business. A telecom or chip foundry can post strong OCF while sinking every dollar into the equipment that produces next year's OCF. Stop investing and OCF collapses in two or three years.
Example: A retailer reports $120 million in OCF on $1 billion in revenue. Net income is $80 million. The $40 million gap is $30 million of depreciation on its store base plus a $10 million release of inventory the company chose not to restock. Operating cash flow looks healthy. The real question, only FCF answers, is how much of that $120 million has to be reinvested in stores before any of it reaches owners.
What Free Cash Flow Tells You
Free cash flow subtracts capital expenditures from operating cash flow. Capex is money spent on property, plant, equipment, and other long-lived assets the business needs to function. Two flavors matter. Unlevered FCF (FCFF) is cash available to all capital providers and the standard input to a DCF model. Levered FCF (FCFE) is what is left for shareholders after interest and scheduled debt payments.
FCF funds dividends, buybacks, and debt reduction. It is also harder to manipulate than net income because capex is reported separately. Warren Buffett's owner earnings concept, born in Berkshire's deep-value tradition, is FCF with maintenance capex carved out from growth.
Limitation: FCF is noisy. A single year of heavy growth capex can show negative FCF even when the underlying business is healthy. Acquisitions, lease accounting changes, and lumpy capex cycles all distort single-period readings. Normalize over three to five years to see the trend.
Example: A software firm runs the same $1 billion revenue but posts $250 million in OCF and only $20 million in capex. FCF lands at $230 million, a 92% conversion of operating cash. A factory operator at the same $250 million OCF but $150 million in capex finishes at $100 million, a 40% conversion. Identical operating cash, very different cash to owners.
When to Use OCF vs FCF
The table pairs scenarios with the metric that gives the cleaner answer.
| Scenario | Better metric | Why |
|---|---|---|
| Earnings-quality check | OCF | Compare against net income; capex is a separate signal |
| Working capital diagnostics | OCF | Captures AR and inventory swings directly |
| Software, asset-light services | Either | Capex is small, so OCF and FCF nearly converge |
| Telecom, utilities, semis, autos | FCF | Capex is the main story; OCF flatters it |
| DCF intrinsic valuation | FCF (FCFF) | Standard discounted-cash-flow input |
| Dividend safety check | FCF | Dividends come from FCF, not OCF |
| Cyclical businesses (multi-year) | FCF (normalized) | Smooth single-year capex spikes across the cycle |
Use OCF when: You are testing whether reported profits are backed by cash. The OCF / net income ratio is the simplest earnings-quality screen. OCF catches working-capital trouble, like receivables outpacing revenue, before it surfaces on the income statement.
Use FCF when: You are pricing the business. DCF, FCF yield, dividend coverage, and debt paydown all start from FCF. For capital-intensive sectors, OCF overstates the cash actually available to owners; the FCF vs EBITDA pairing shows the same trap one level higher.
Using OCF and FCF Together
Run both and watch the ratio. FCF divided by OCF tells you how much of each operating dollar survives capex. A software business sits near 90%. A capex-heavy industrial runs 30% to 50%. The number is not good or bad alone; it tells you what the business needs to keep going.
Trend matters more than level. Falling FCF/OCF over five years means capex is growing faster than the underlying business. Sometimes that is intentional growth investment; sometimes it is sustaining capex creeping up as the asset base ages. The 10-K split between maintenance and growth capex is the difference between investing in the future and treading water.
Pair both with negative free cash flow analysis when FCF turns red. A company with positive OCF and negative FCF is reinvesting heavily: fine if the projects pay back, dangerous if not. A company with negative OCF and negative FCF is burning cash from operations, a worse problem.
Each metric earns its place. OCF bridges accounting earnings to real cash. FCF is the residual claim after the business has paid to keep itself running. See the full comparisons guide for how OCF, FCF, and other cash-flow pairings line up against valuation multiples and returns metrics. A discounted cash flow model makes the gap explicit by discounting FCF, not OCF.
Frequently Asked Questions
What is the difference between operating cash flow and free cash flow? Operating cash flow is the cash a company generates from its core operations after working capital changes. Free cash flow is operating cash flow minus capital expenditures. The gap is the cost of keeping the business running. For asset-light firms the gap is small. For capex-heavy firms it can swallow most of the operating cash.
Can a company have positive operating cash flow but negative free cash flow? Yes, and it happens often. A growth-stage business can post strong operating cash flow and still spend more than that on capex, leaving negative free cash flow. The question is whether the capex is sustaining capex or growth capex. Growth capex with a payback is fine. Sustaining capex that keeps creeping up is a warning sign.
Which is better for valuation, operating cash flow or free cash flow? Free cash flow, for almost every valuation purpose. DCF models discount free cash flow, not operating cash flow, because capex is a real cost of doing business. Operating cash flow is the better metric for earnings quality checks, where you compare it against net income to see if profits are backed by cash.
How do you calculate free cash flow from operating cash flow? Take operating cash flow from the cash flow statement and subtract capital expenditures from the investing activities section. The result is unlevered free cash flow, the standard DCF input. For levered free cash flow, subtract scheduled debt payments and interest as well. Both numbers sit on the same statement, two sections apart.